Examples
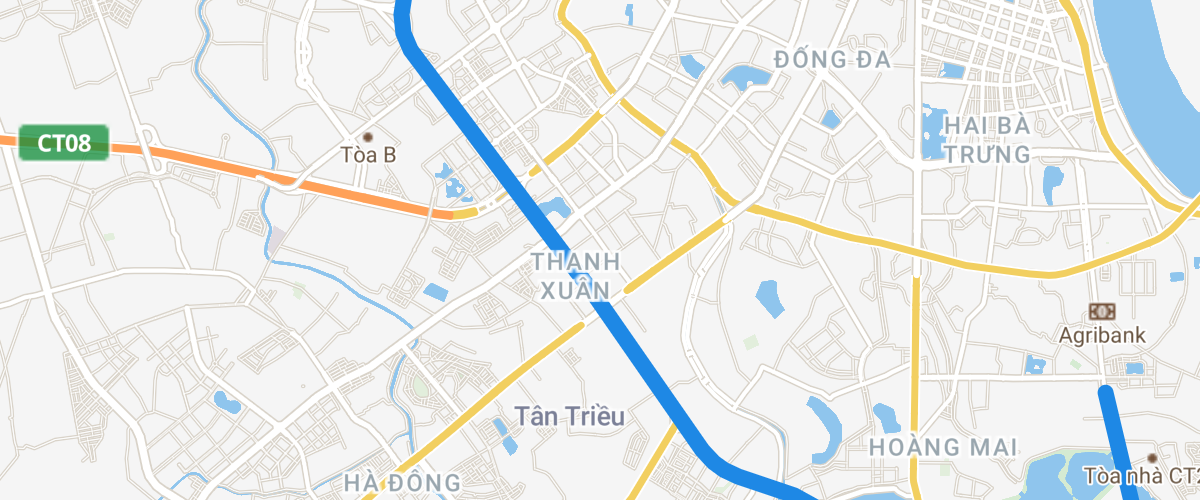
 Add a GeoJSON line
Add a GeoJSON line to a map using addSource, then style it using addLayer’s paint properties.

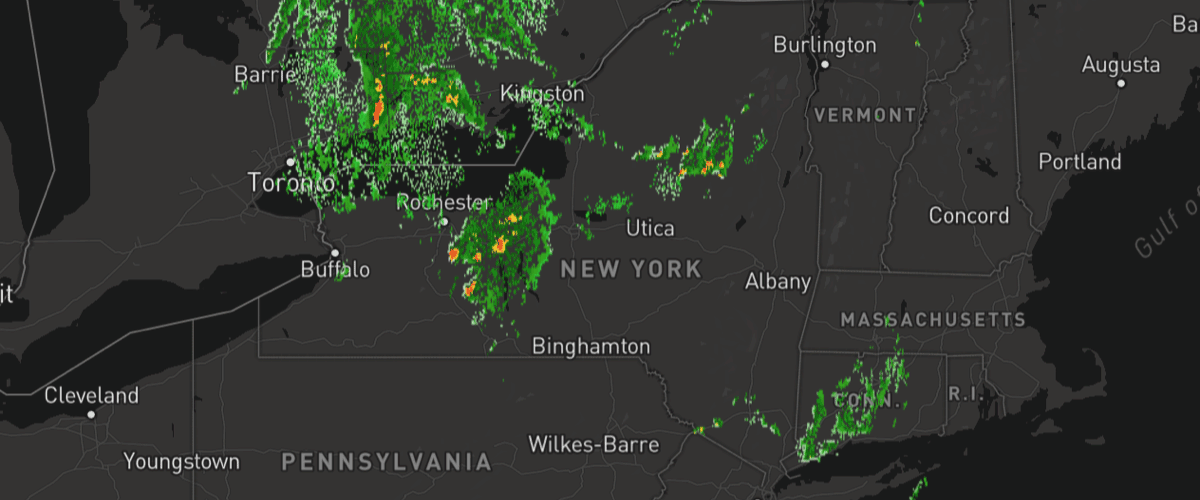
 Add a WMS source
Add an external Web Map Service raster layer to the map using addSource's tiles option.
 Add an animated icon to the map
Add an animated icon to the map that was generated at runtime with the Canvas API.
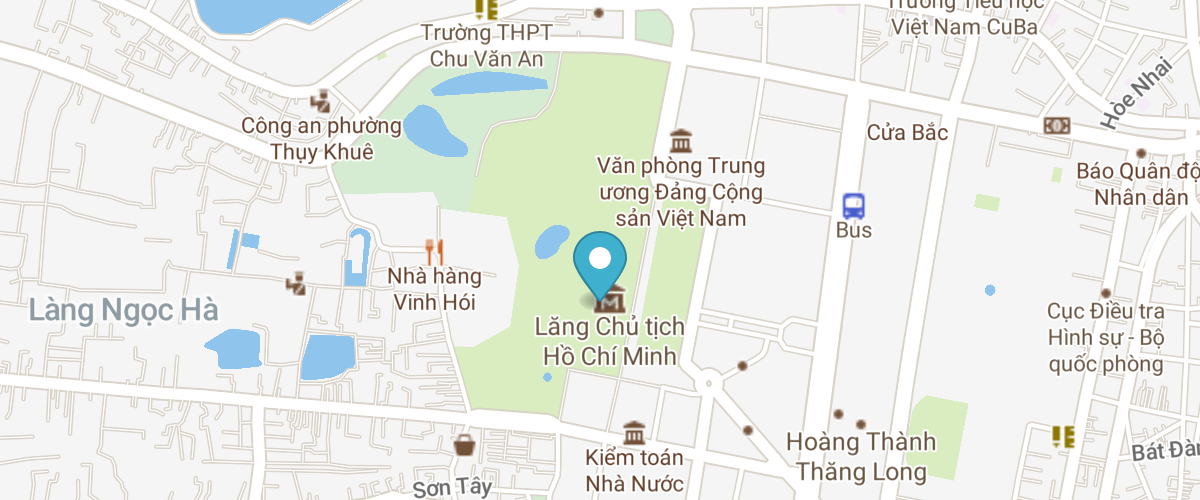
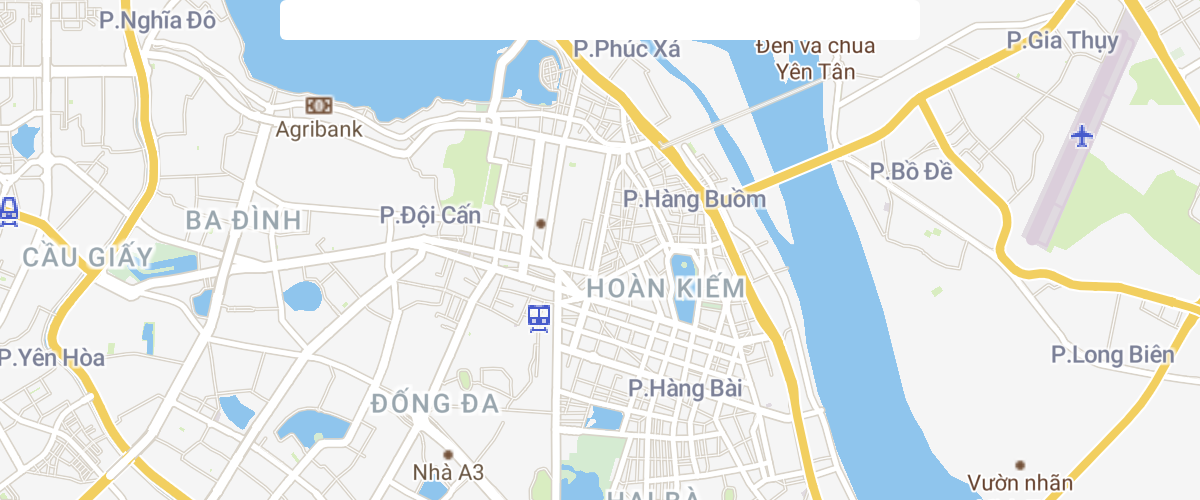
 Add multiple geometries from one GeoJSON source
Add a polygon and circle layer from the same GeoJSON source.
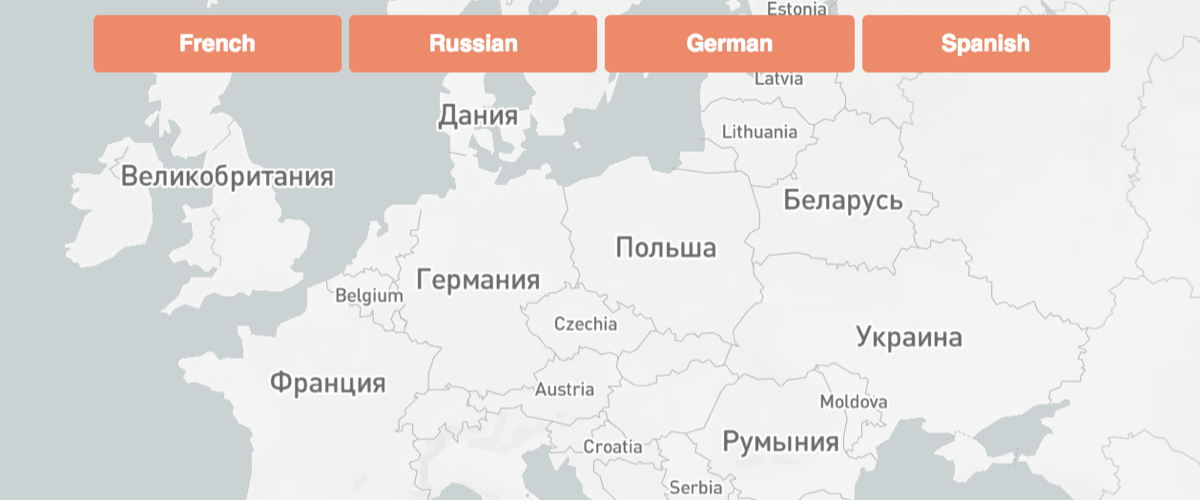
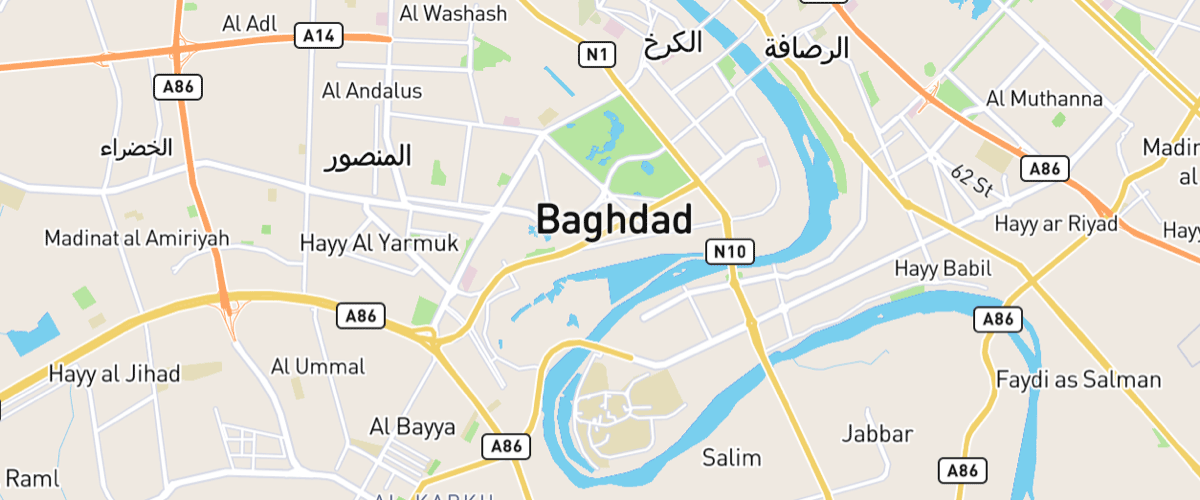 Add support for right-to-left scripts
Use the mapbox-gl-rtl-text plugin to support right-to-left languages such as Arabic and Hebrew.
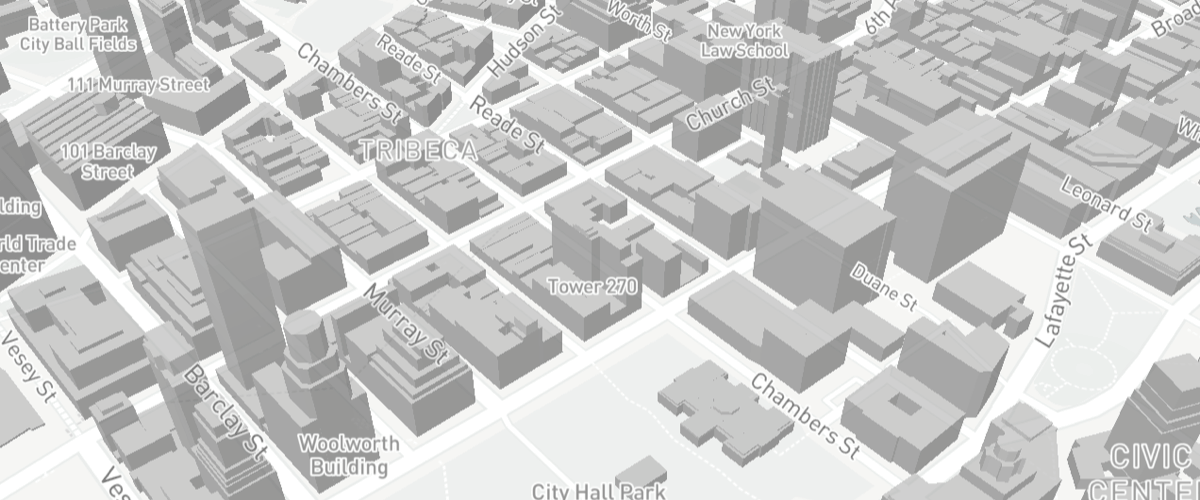
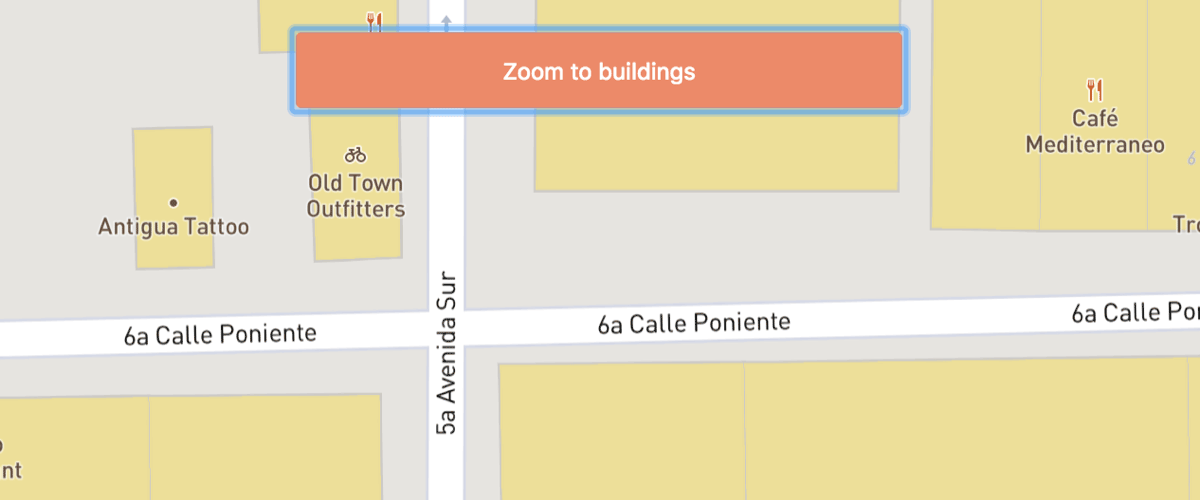 Change building color based on zoom
level
Change building color based on zoom
level
Use the interpolate expression to ease-in the building layer and smoothly fade from one color to the next.
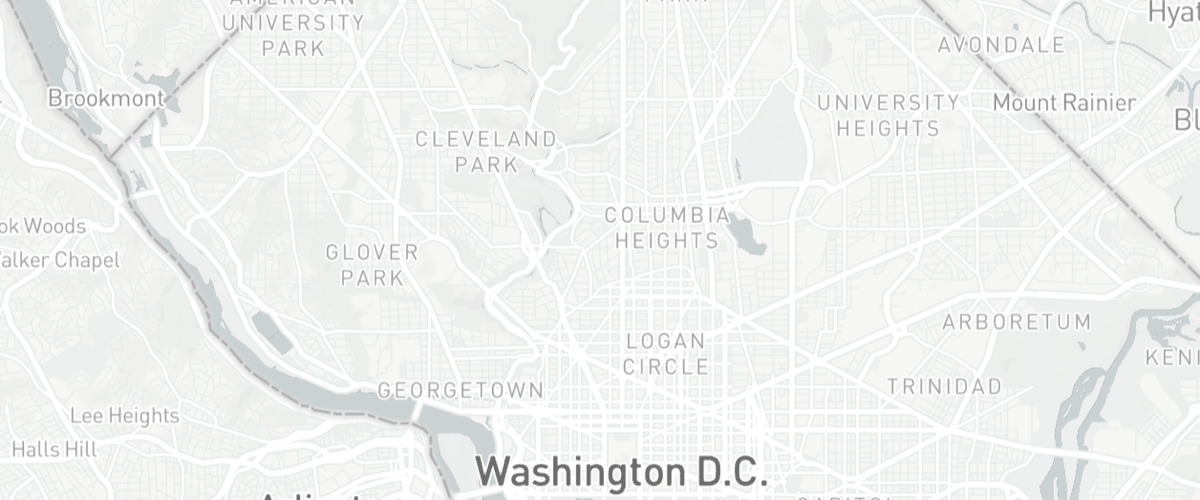 Change the default position for attribution
Place attribution in the top-left position when initializing a map.
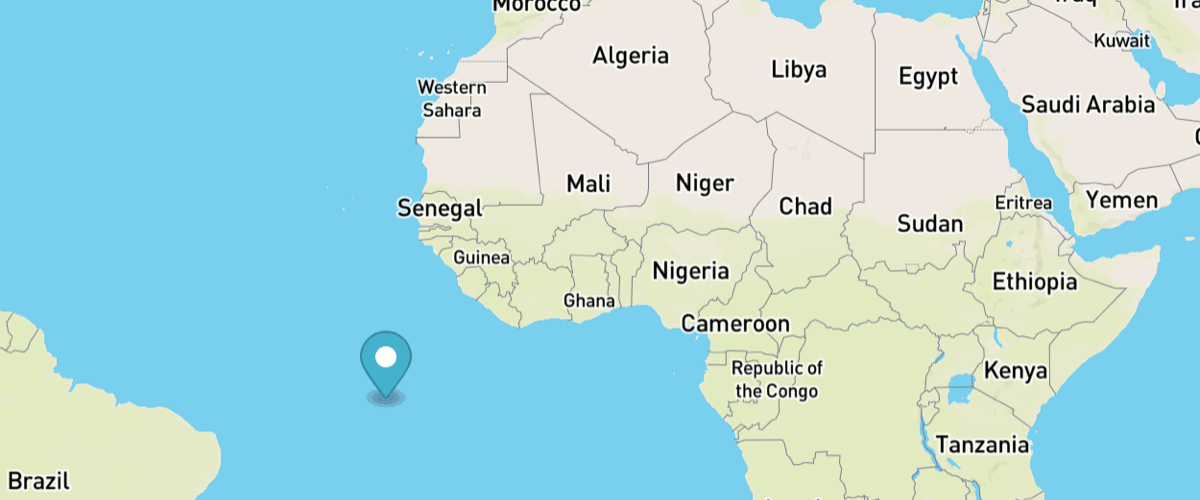
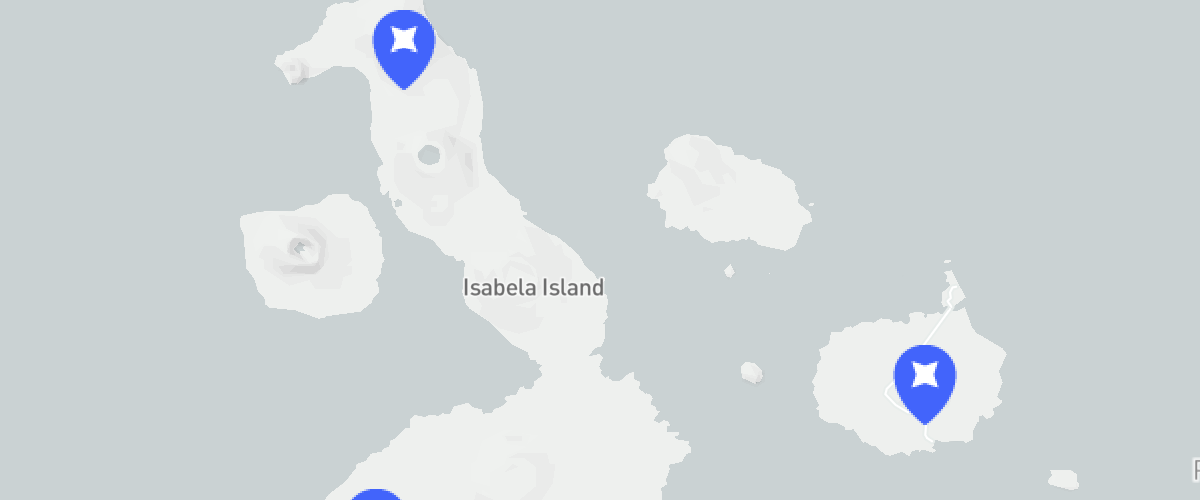
 Create a draggable Marker
Drag the marker to a new location on a map and populate its coordinates in a display.
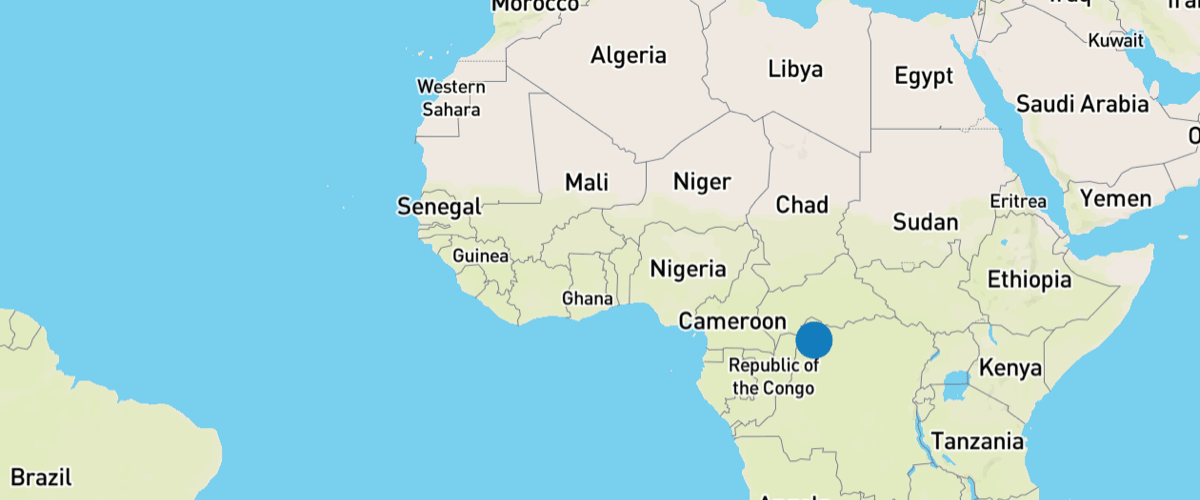
 Create a draggable point
Drag the point to a new location on a map and populate its coordinates in a display.
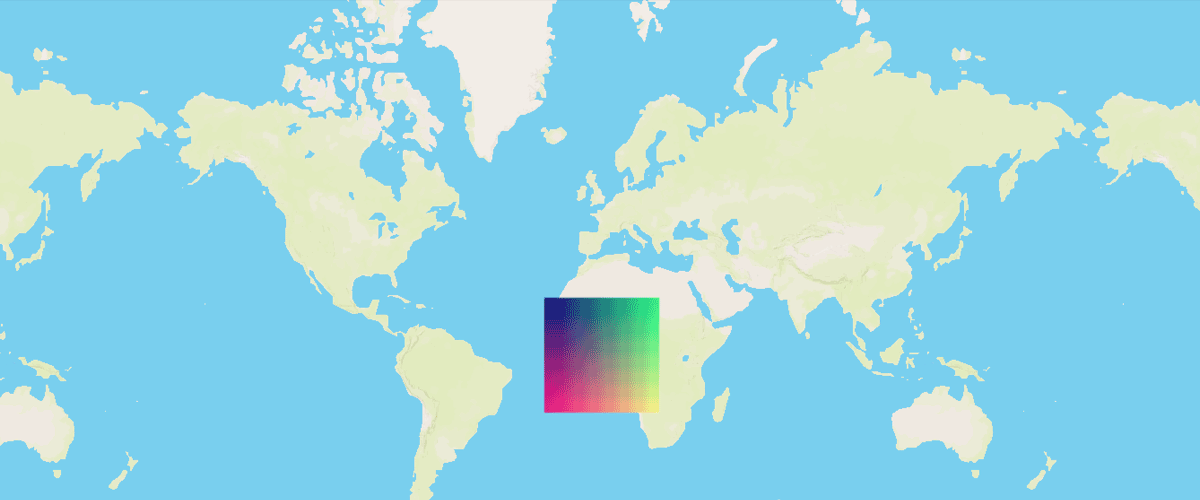
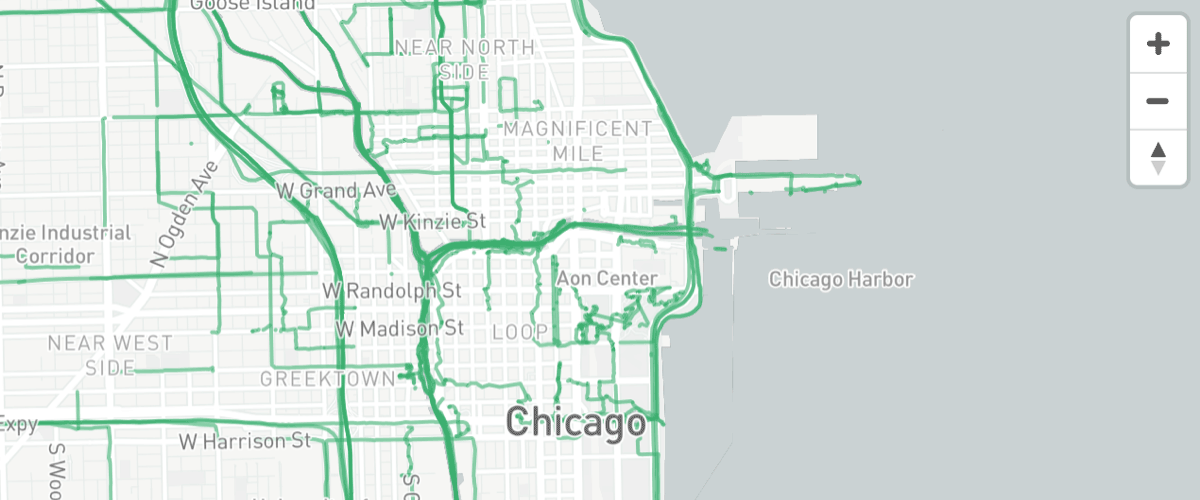
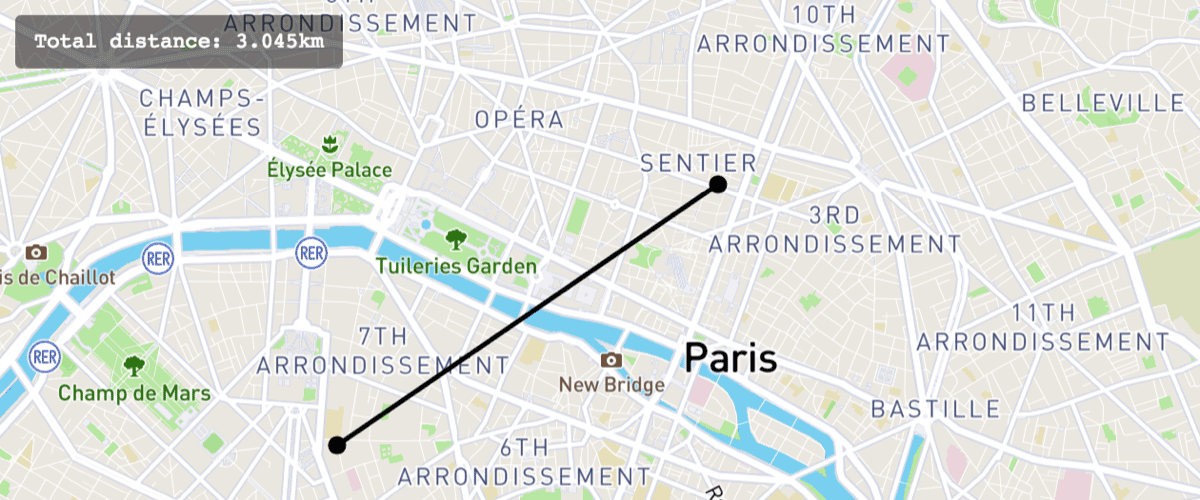
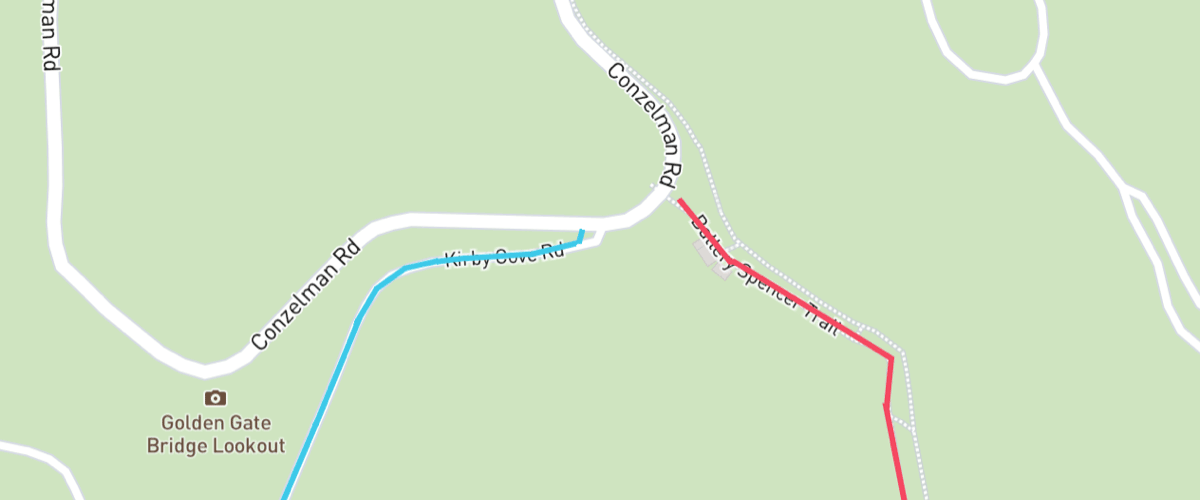
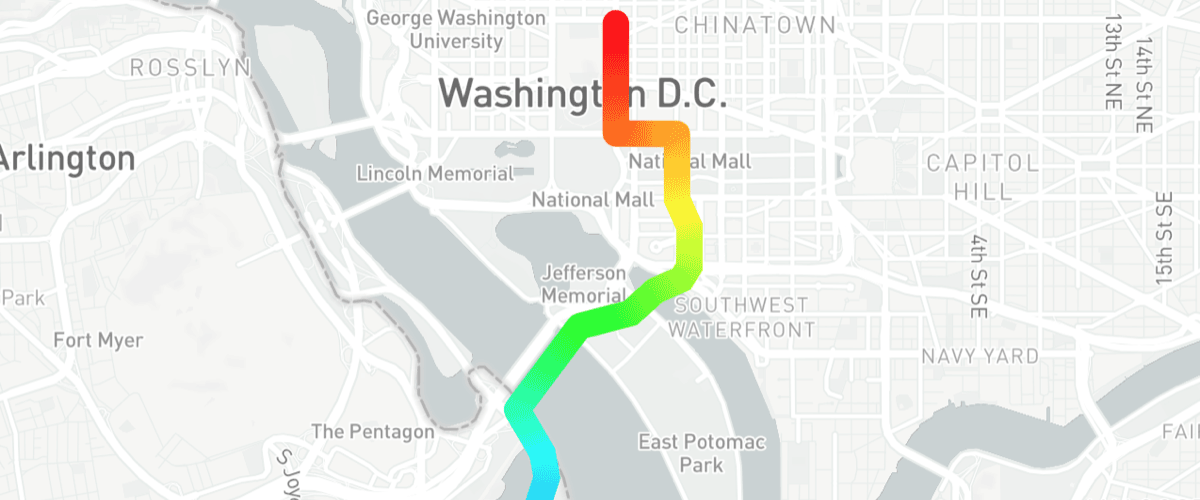 Create a gradient line using an expression
Use the line-gradient paint property and an expression to visualize distance from the starting point of a line.
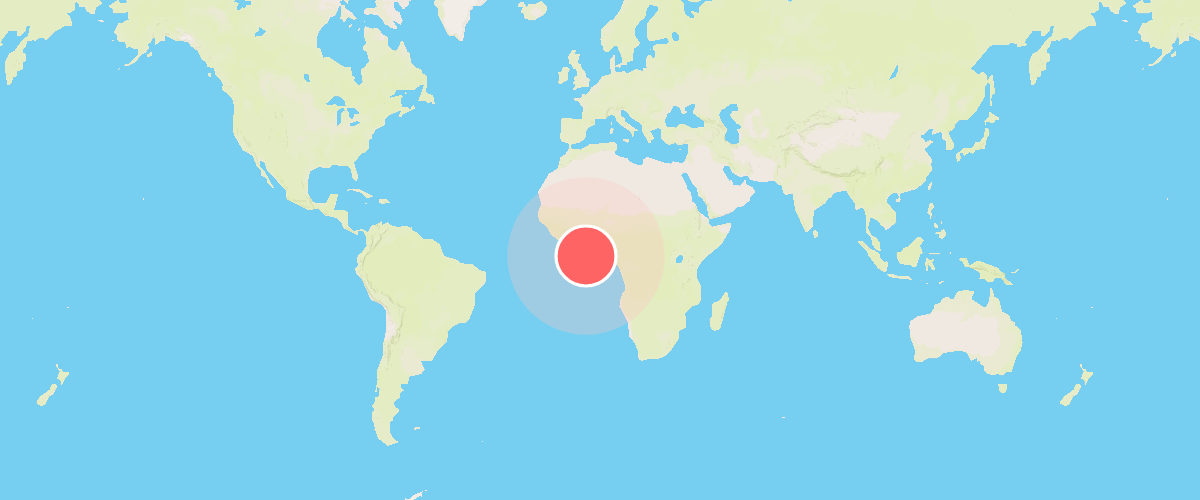
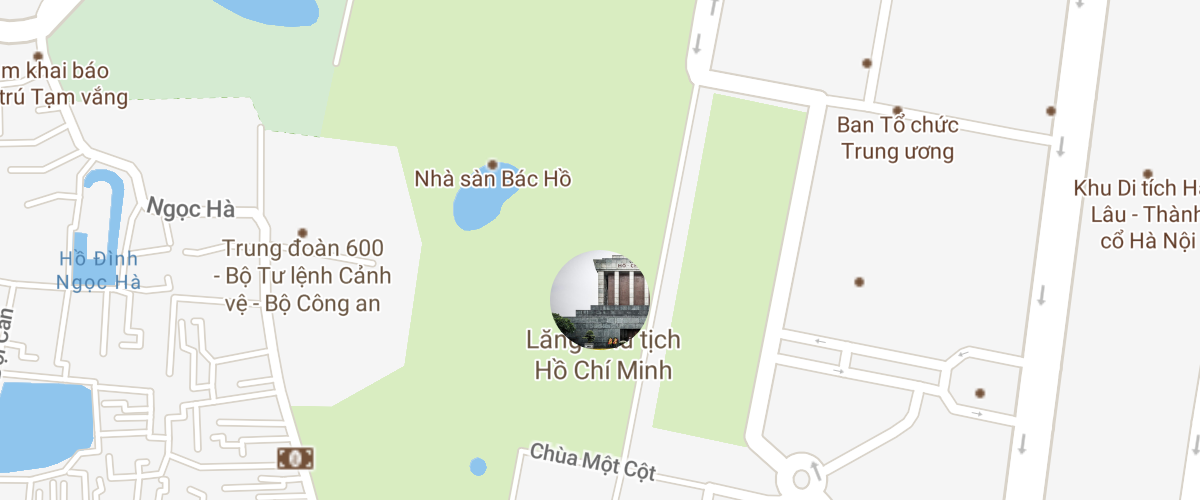
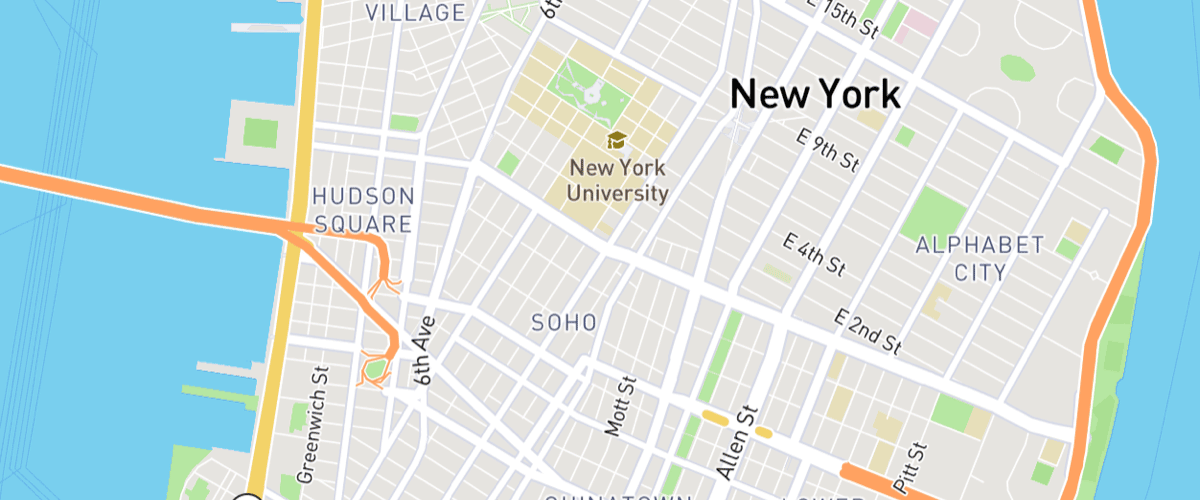
 Display a popup on hover
When a user hovers over a custom marker, show a popup containing more information.
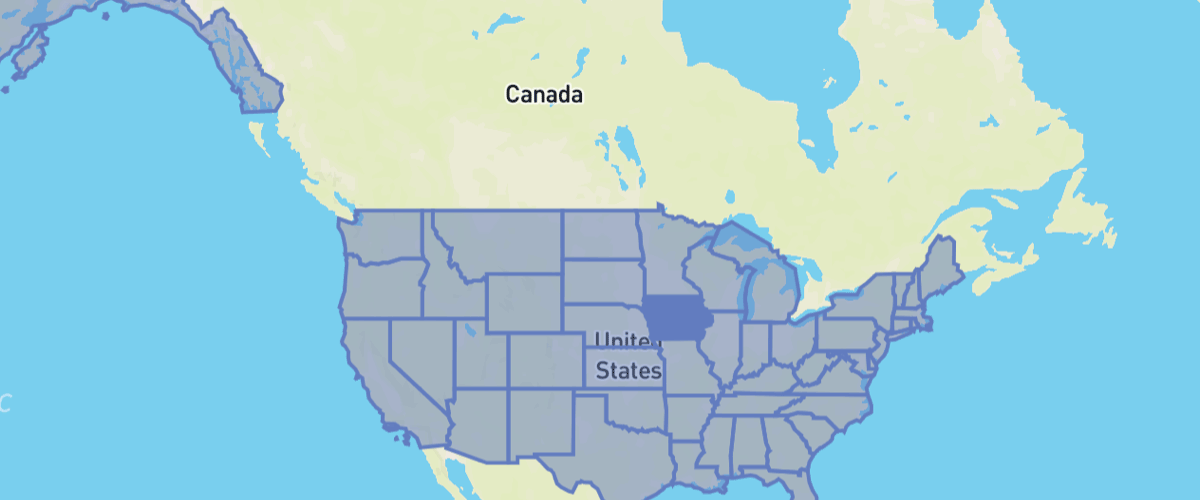
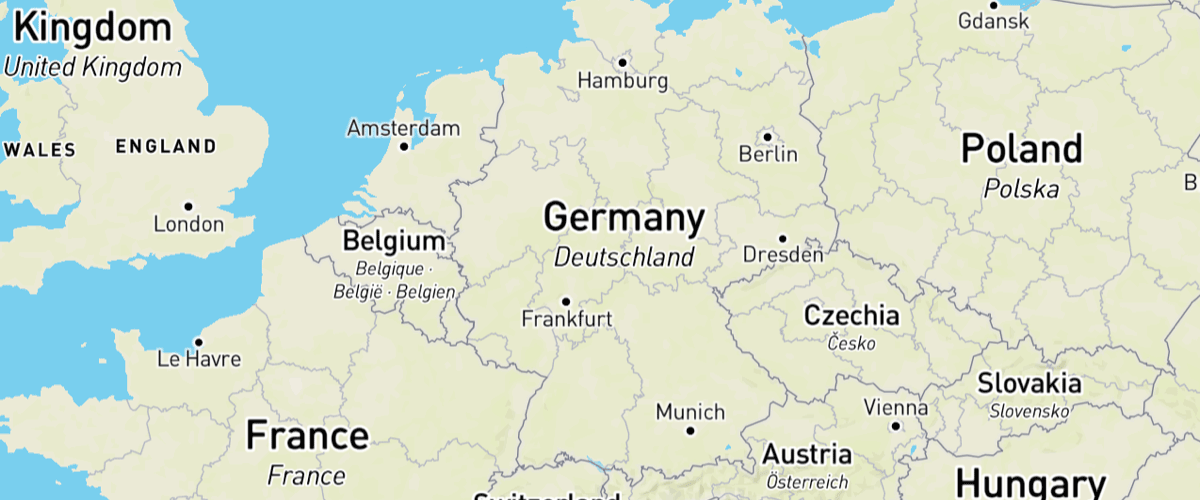 Display and style rich text labels
Use the format expression to display country labels in larger size.
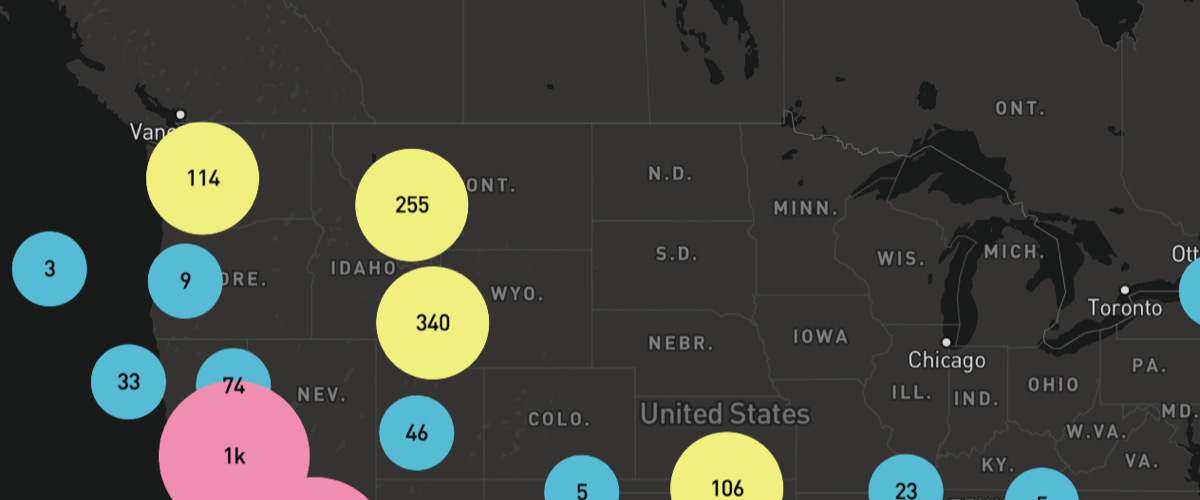
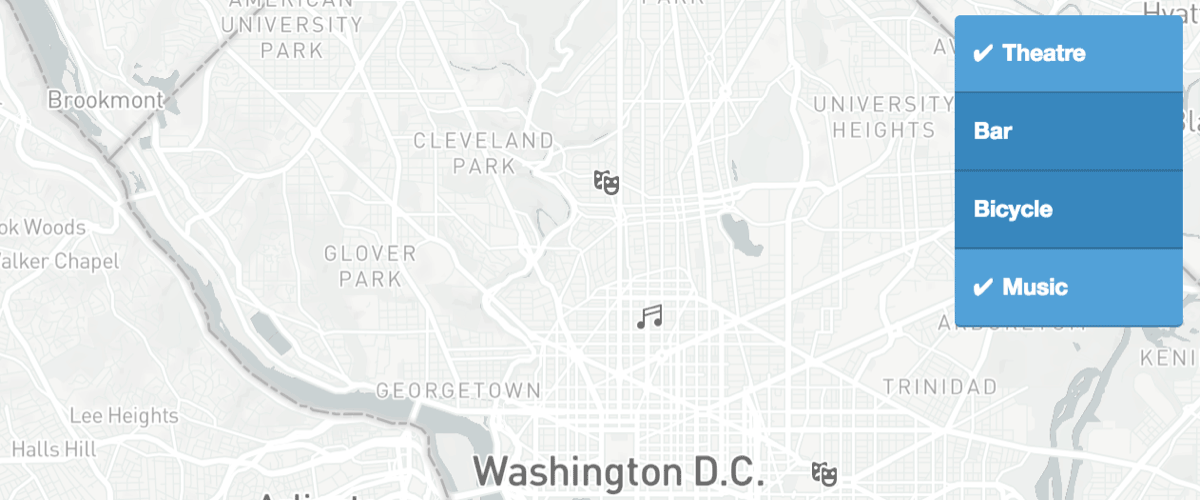
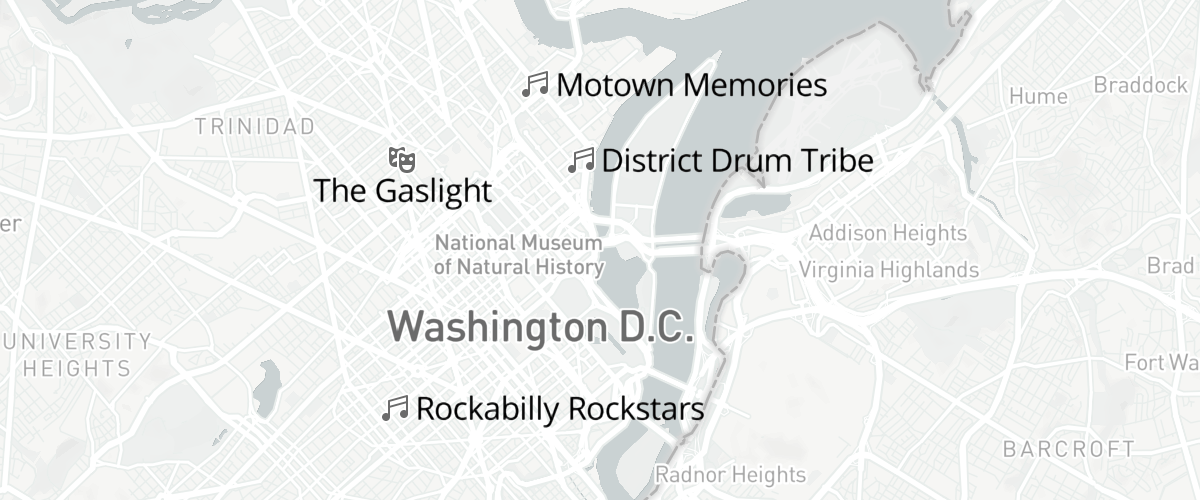
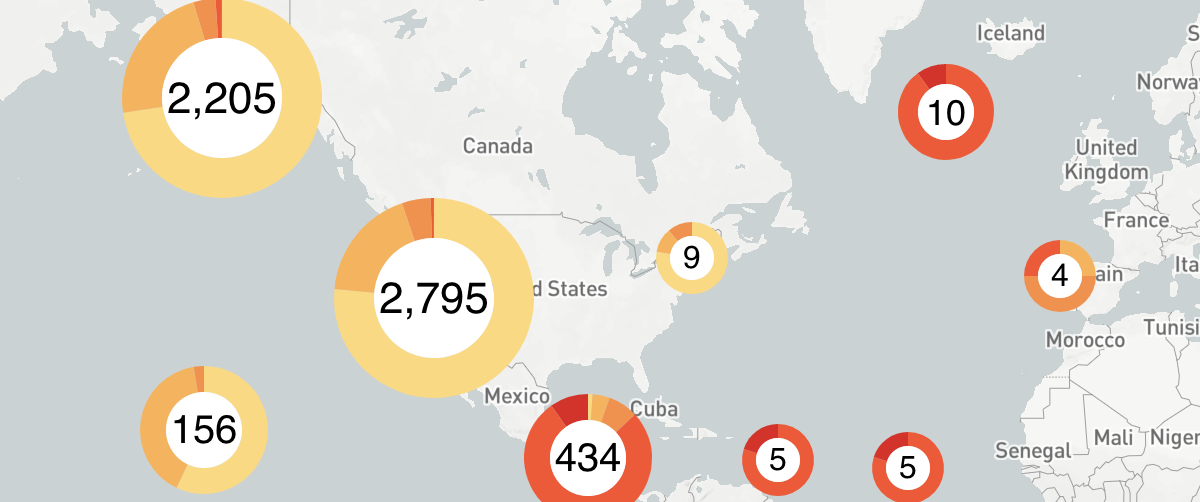 Display HTML clusters with custom properties
Extend clustering with HTML markers and custom property expressions.
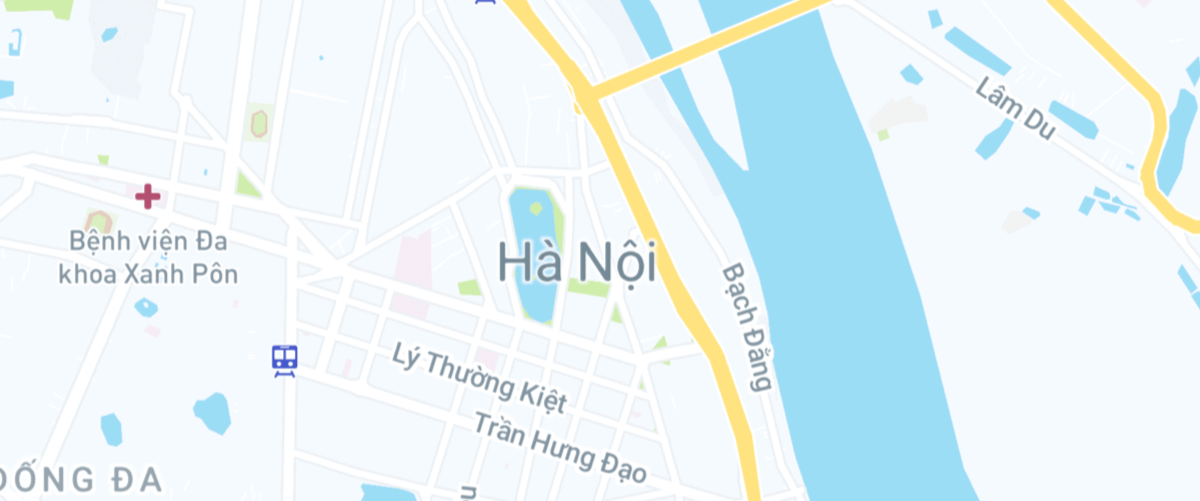
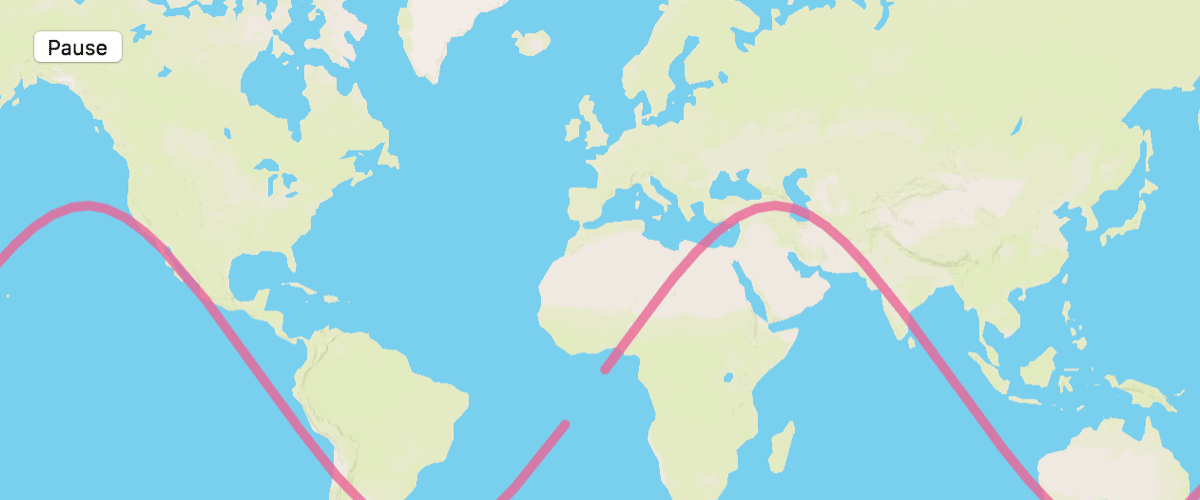
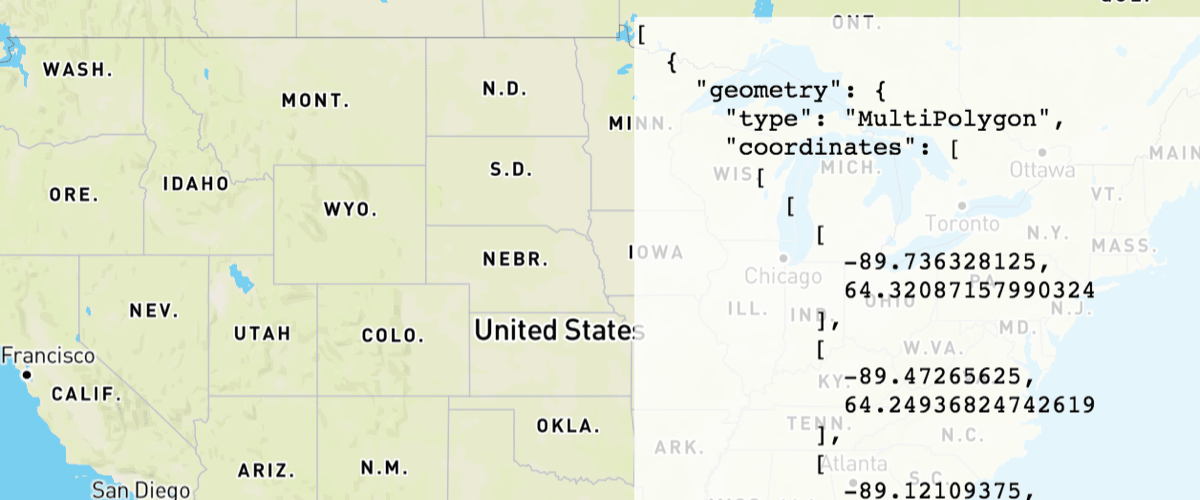
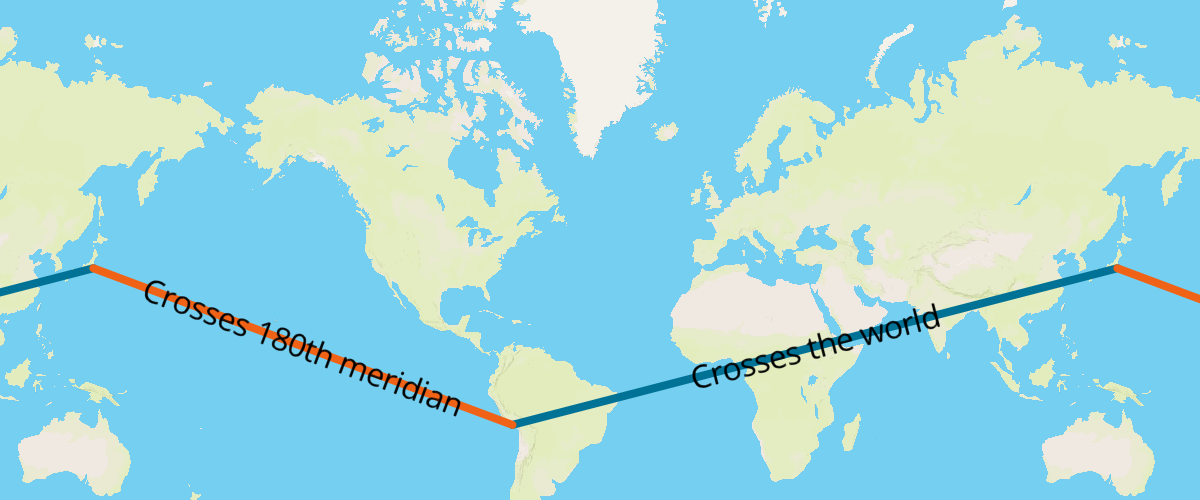 Display line that crosses 180th meridian
Draw a line across the 180th meridian using a GeoJSON source.
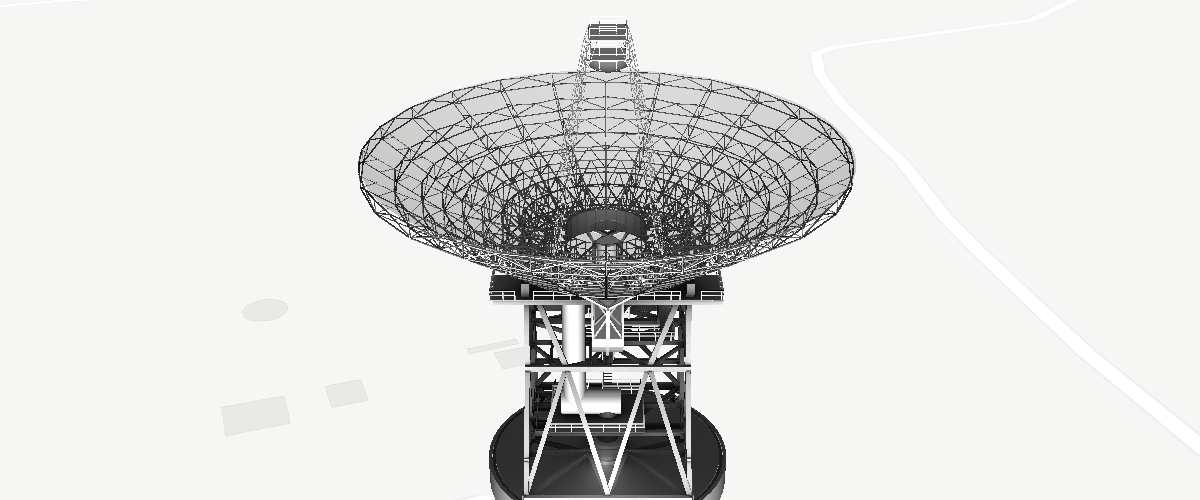
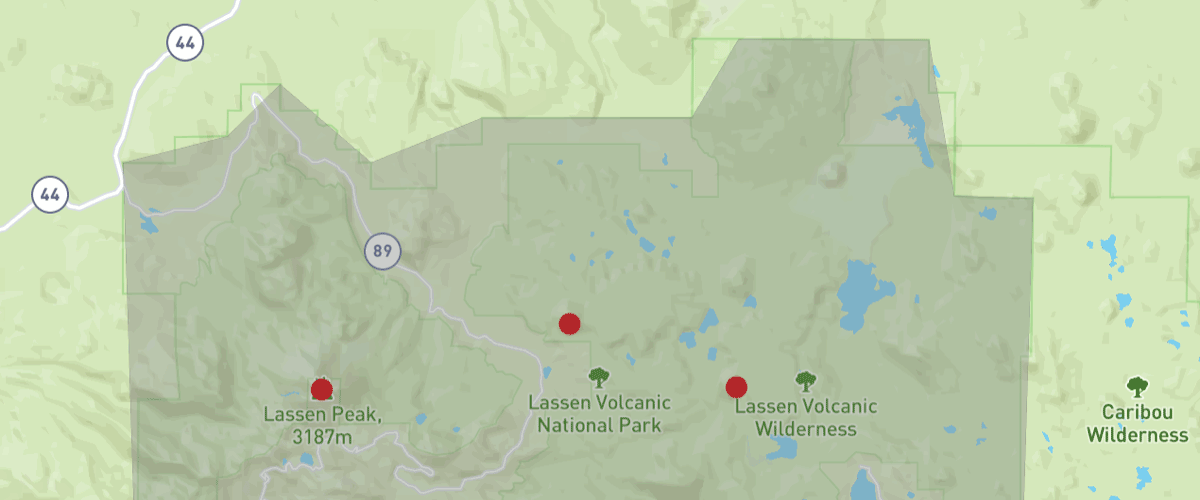
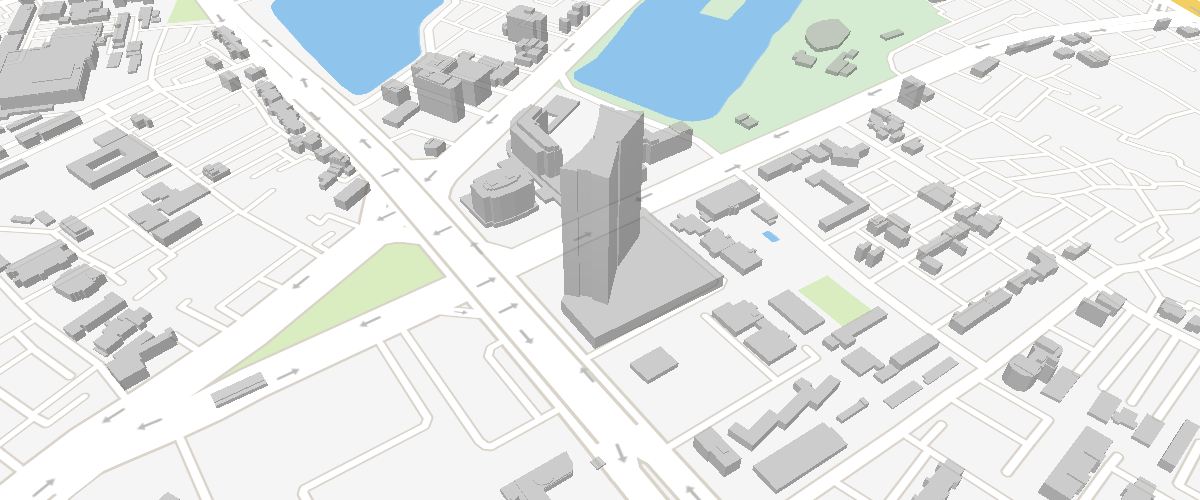
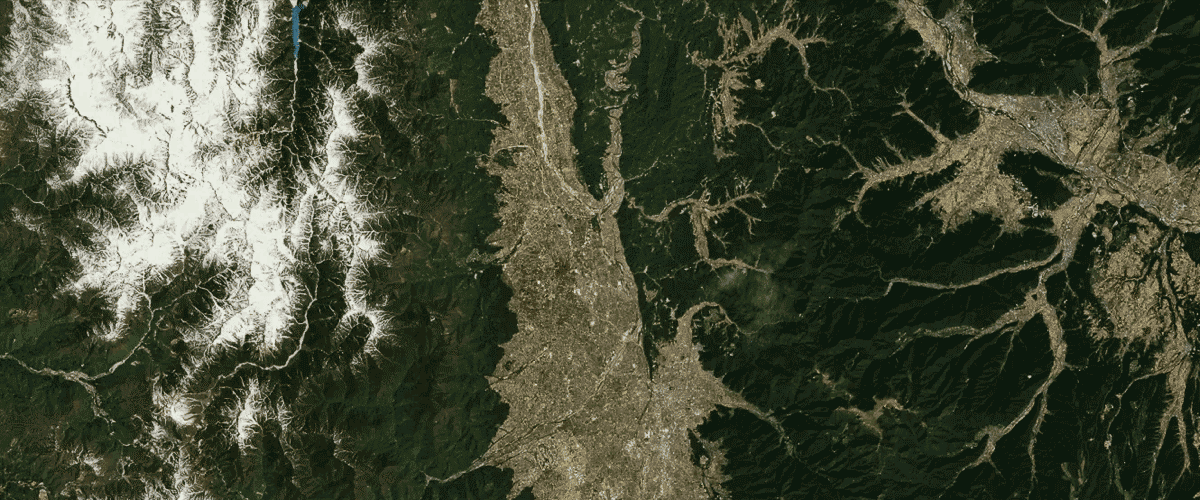
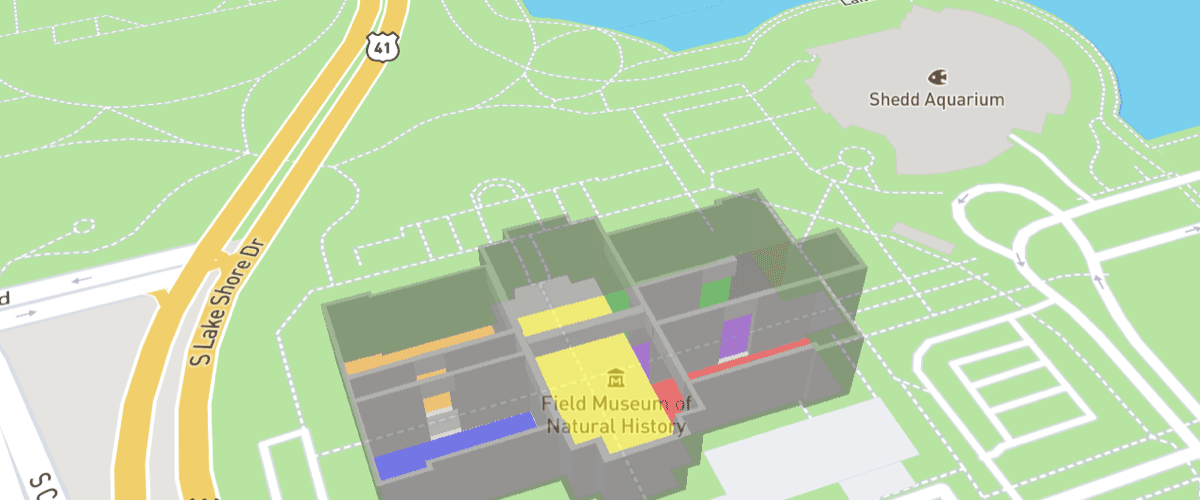 Extrude polygons for 3D indoor mapping
Create a 3D indoor map with the fill-extrude-height paint property.
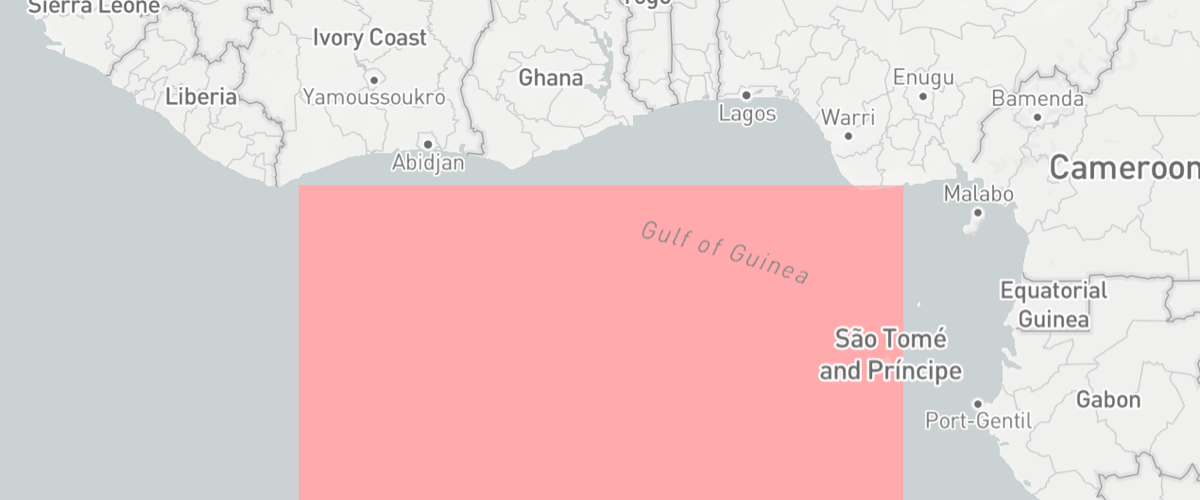
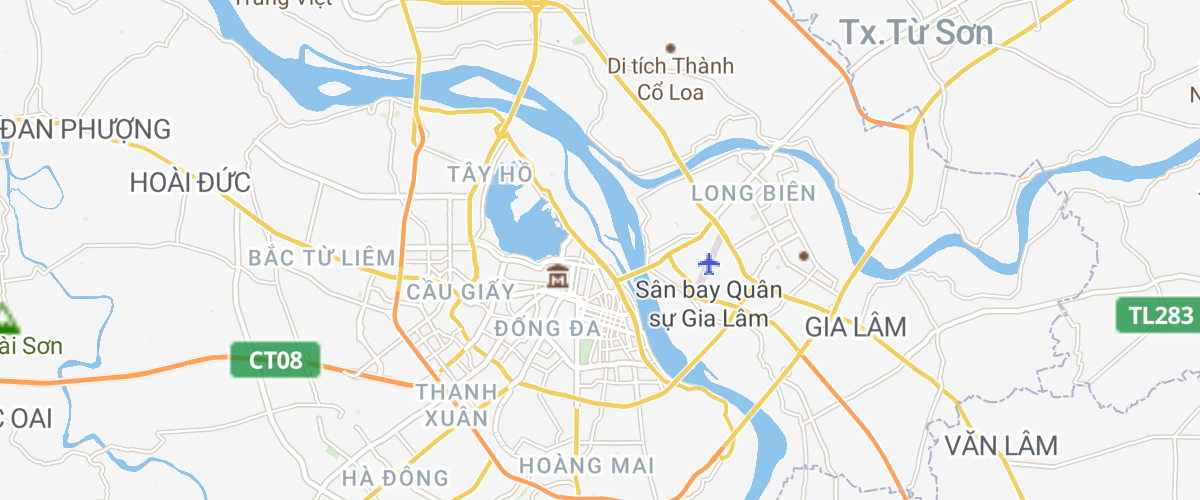
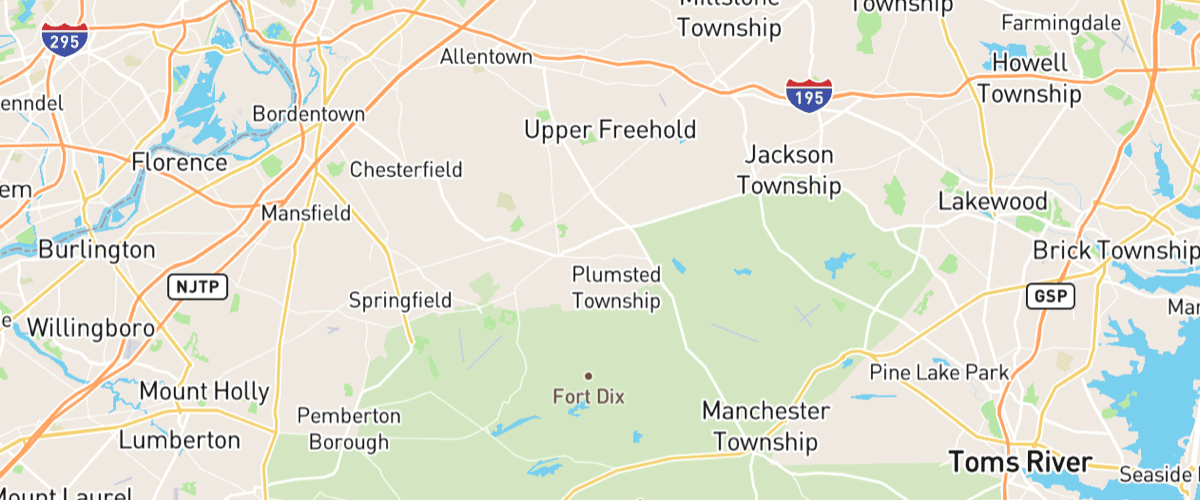
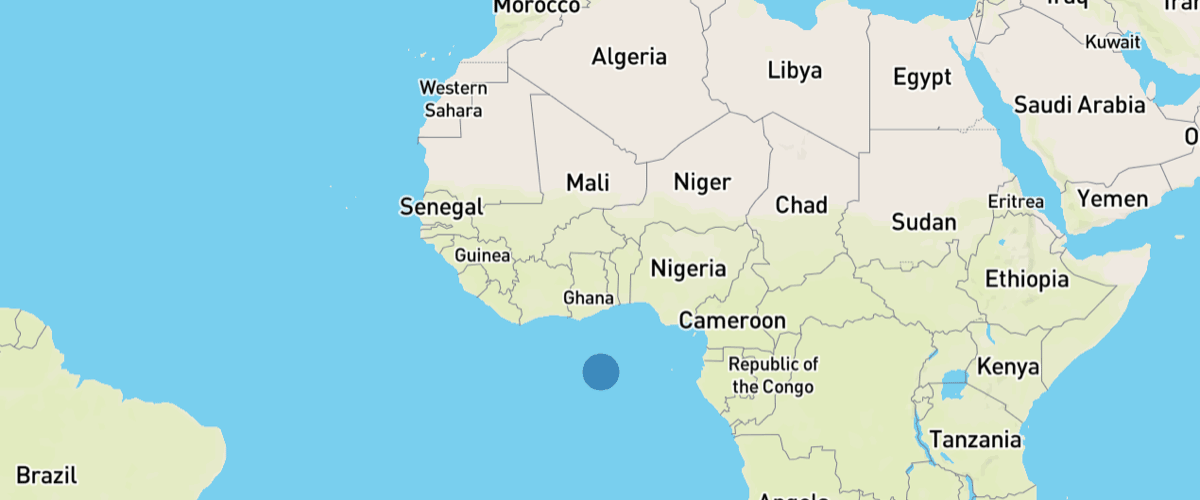
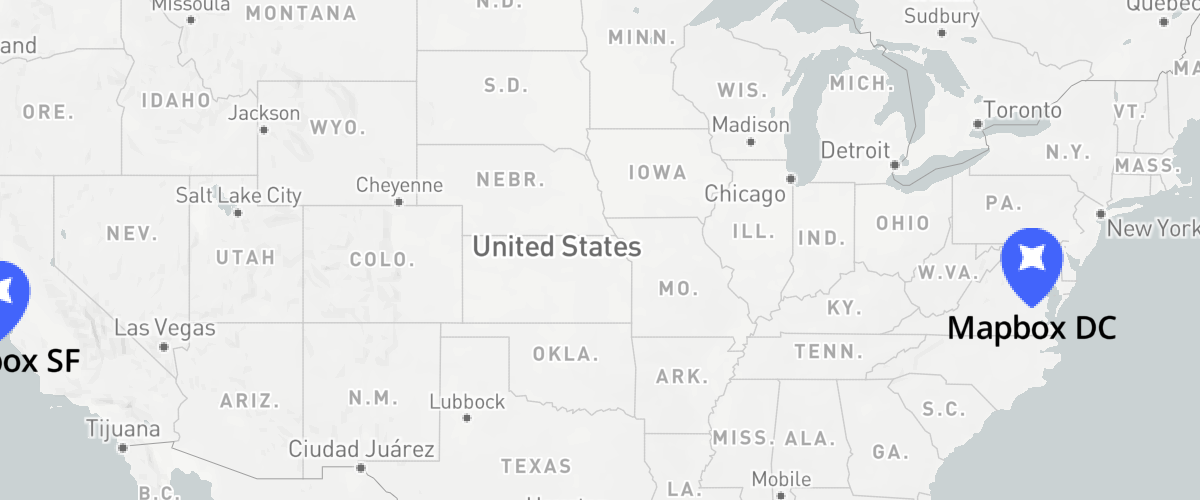
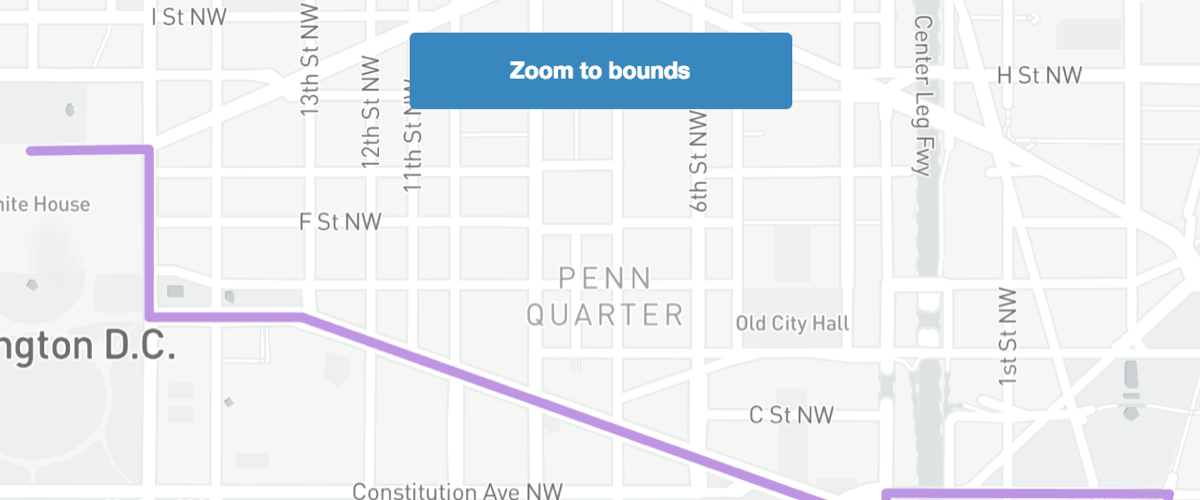
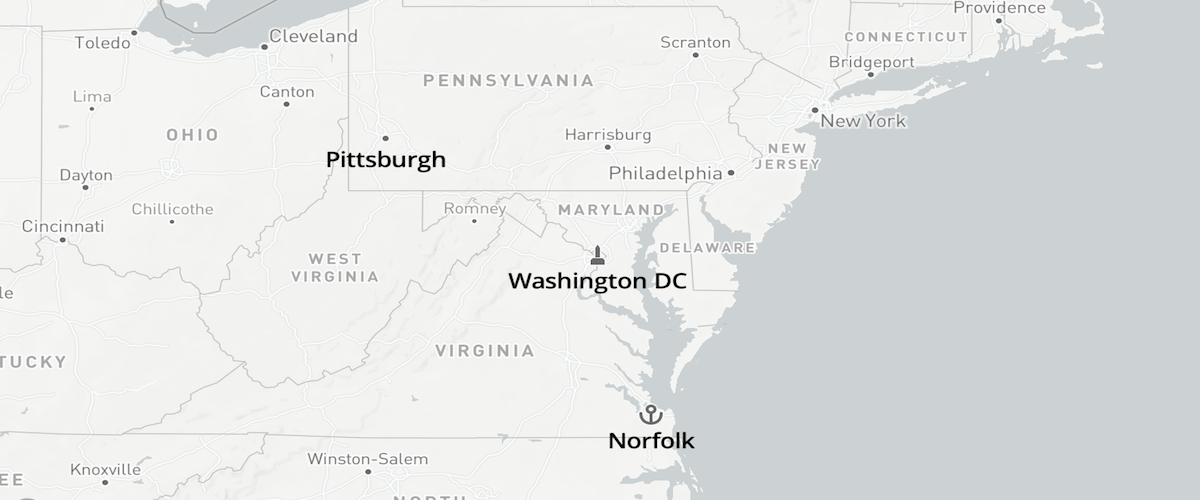
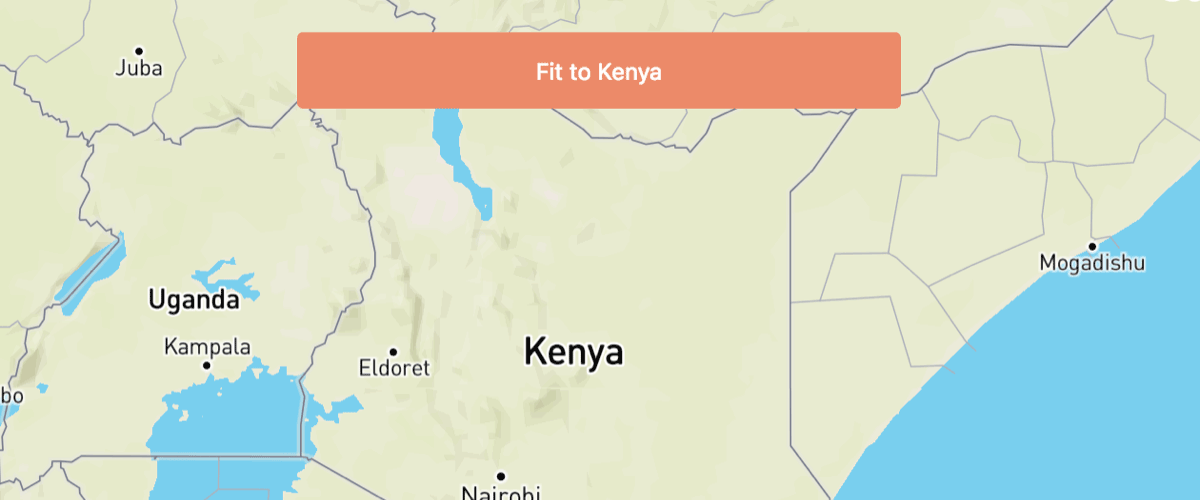 Fit a map to a bounding box
Fit the map to a specific area, regardless of the pixel size of the map.
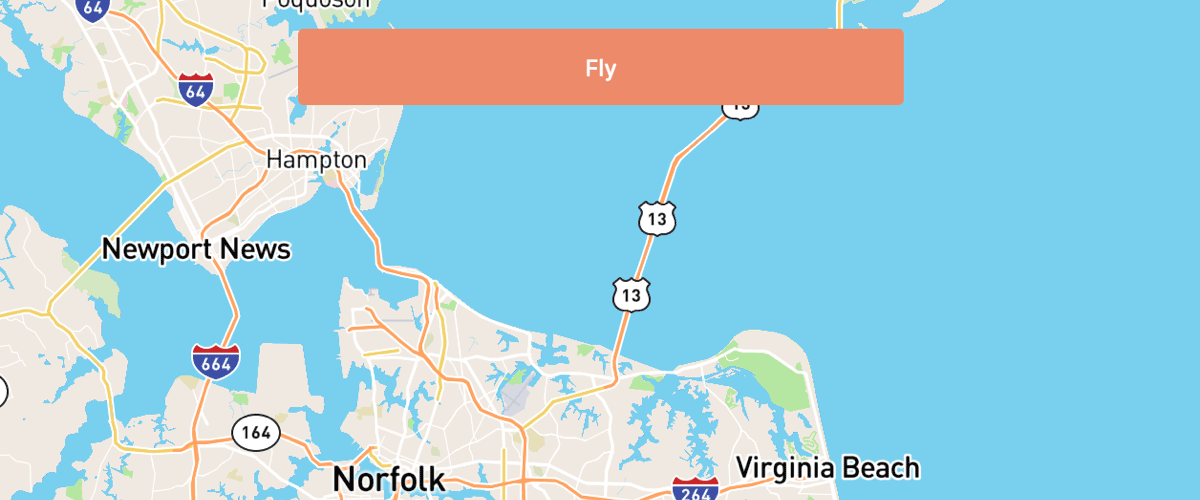
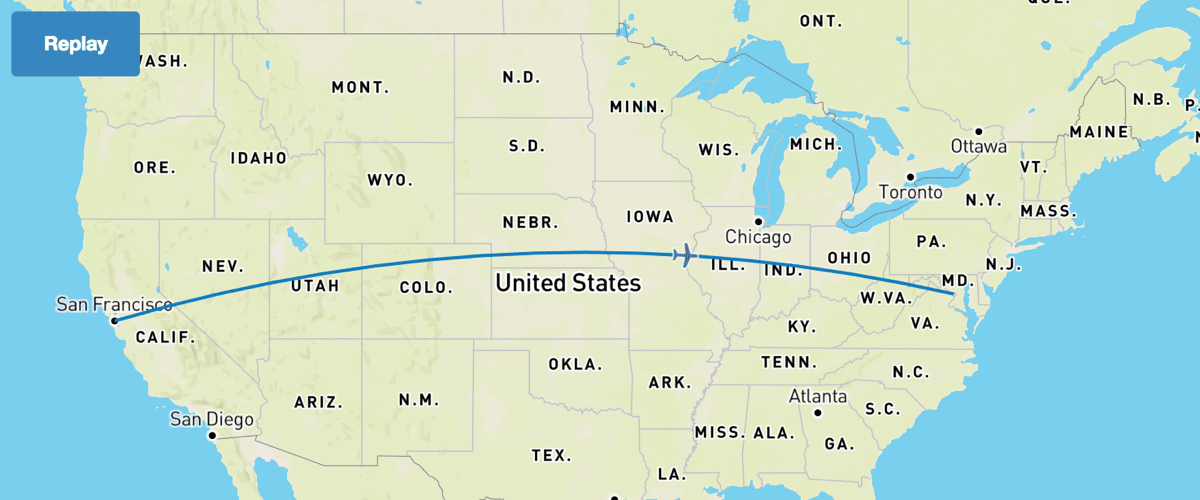
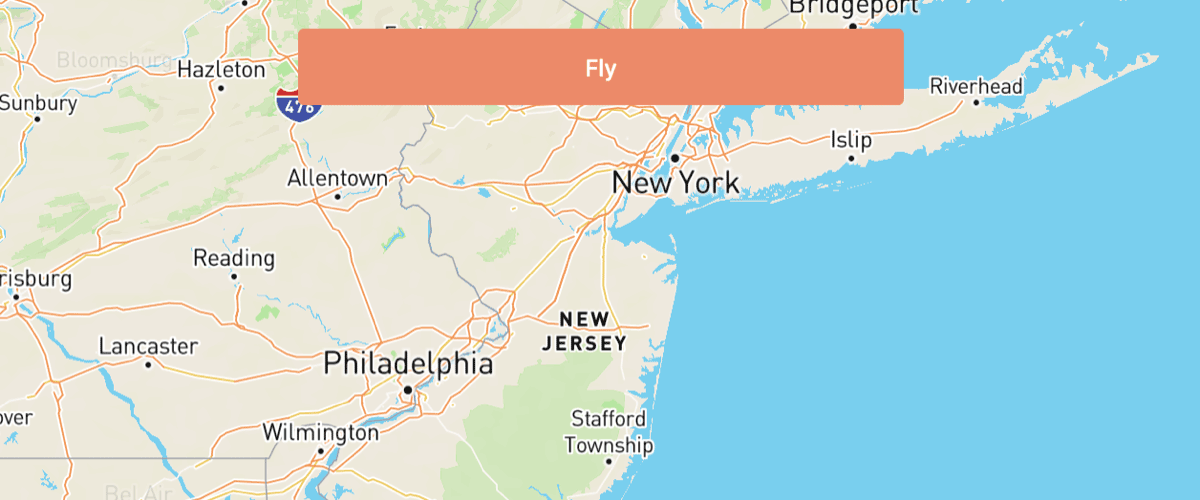
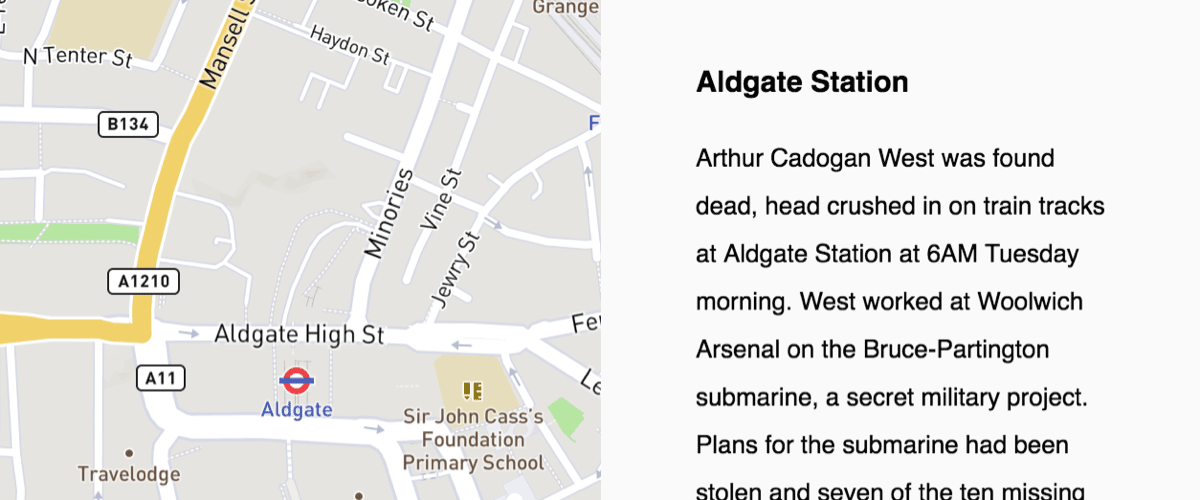 Fly to a location based on scroll position
Scroll down through the story and the map will fly to the chapter's location.
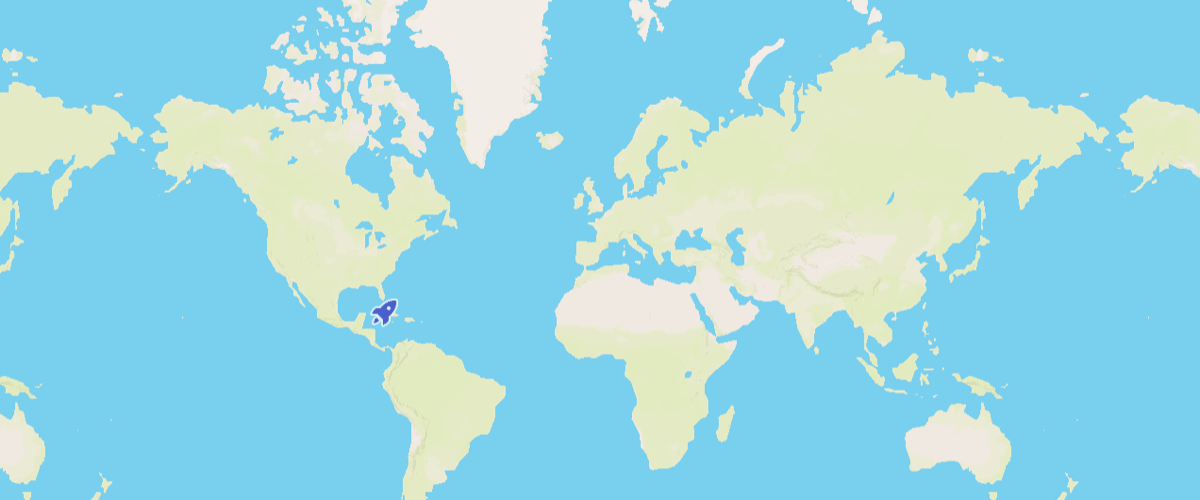
 Generate and add a missing icon to the map
Dynamically generate a missing icon at runtime and add it to the map.
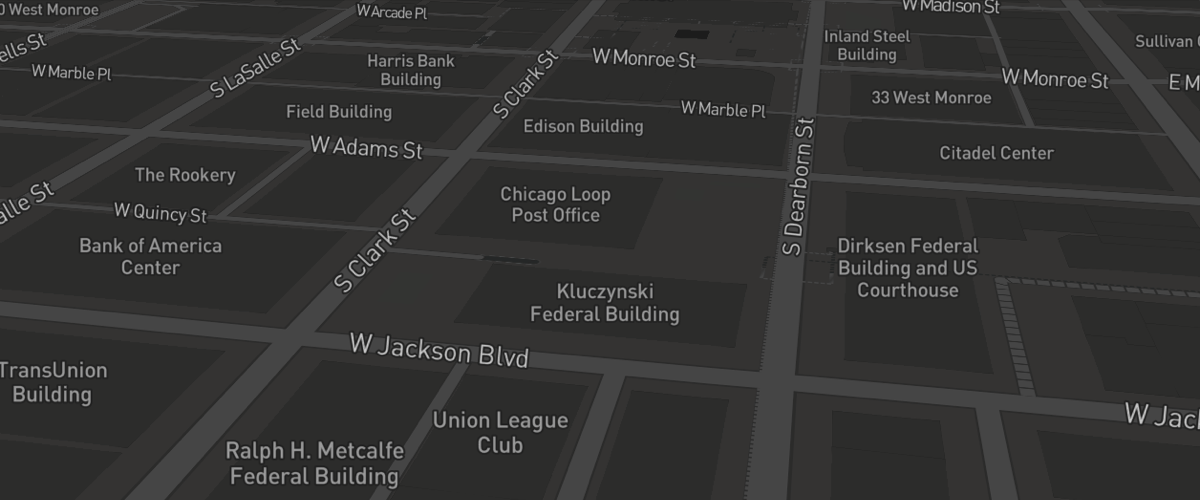
 Get coordinates of the mouse pointer
Show mouse position on hover with pixel and latitude and longitude coordinates.
 Get features under the mouse pointer
Use queryRenderedFeatures to show properties of hovered-over map elements.
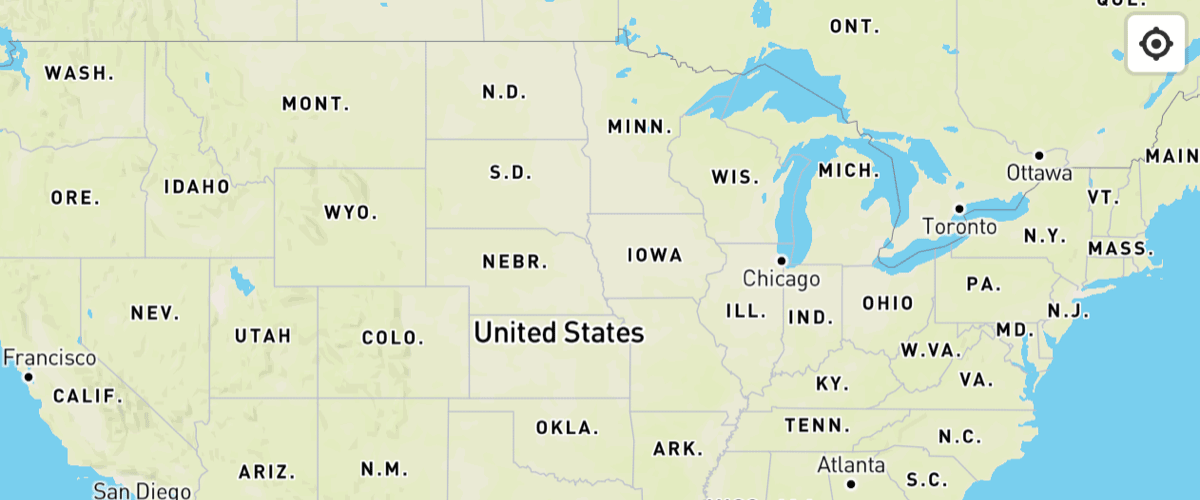 Locate the user
Geolocate the user and then track their current location on the map using the GeolocateControl.
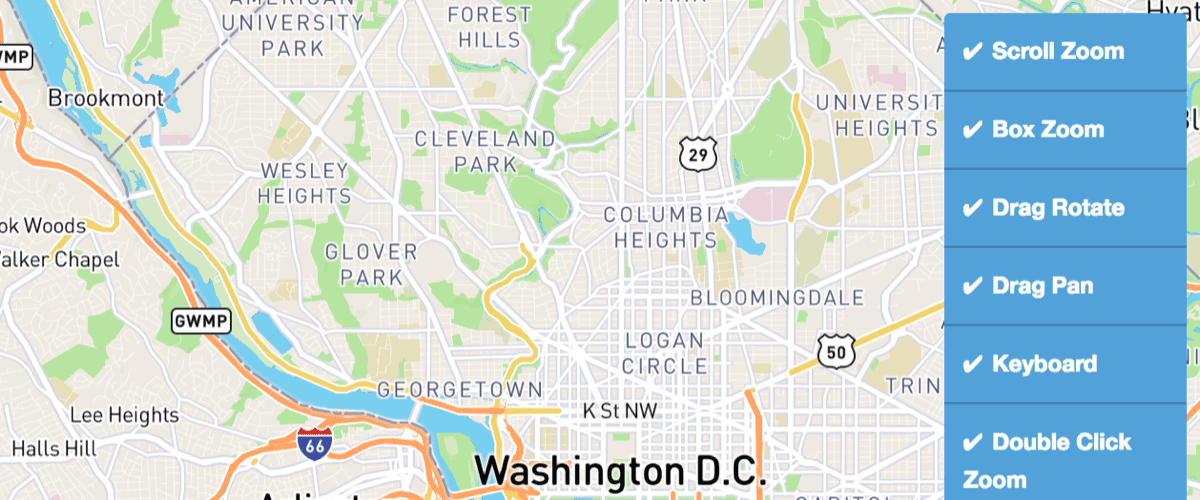
 Navigate the map with game-like controls
Use the keyboard's arrow keys to move around the map with game-like controls.
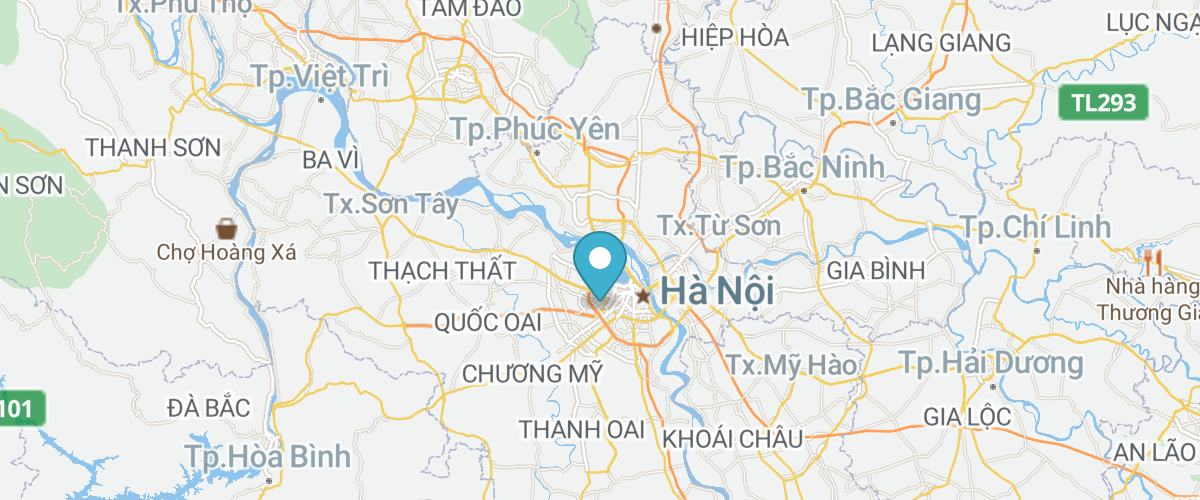
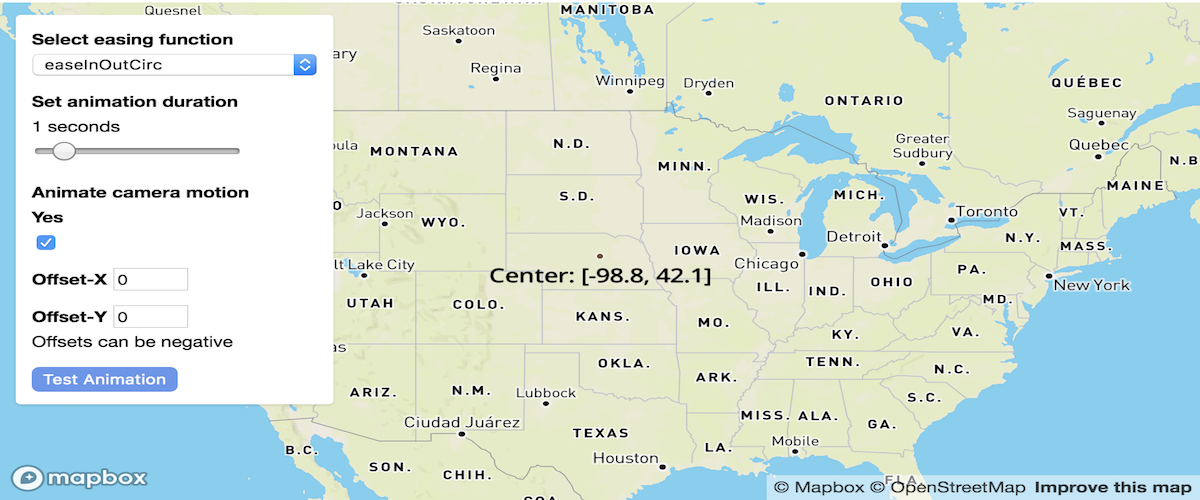
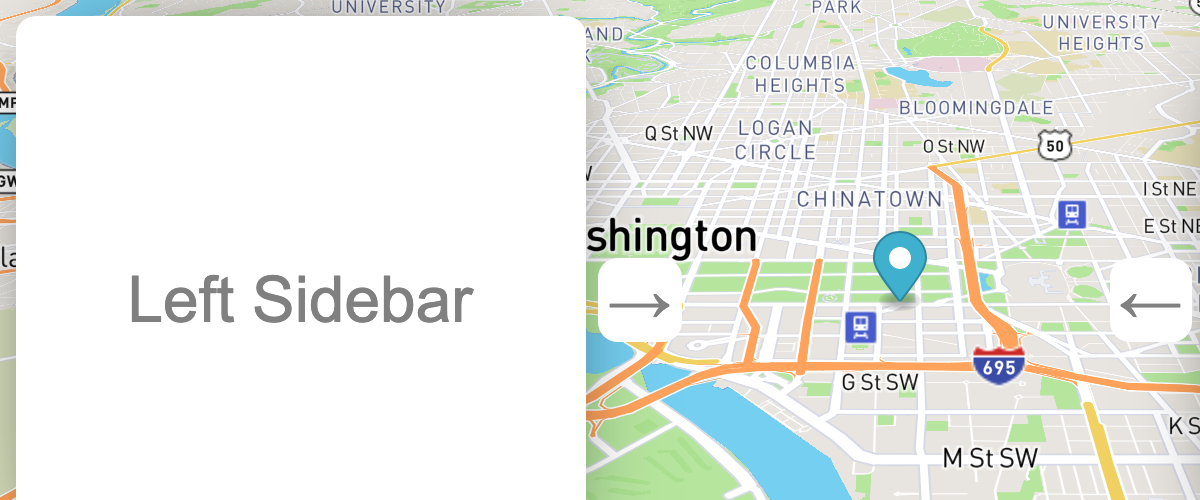 Offset the vanishing point using
padding
Offset the vanishing point using
padding
Offset the center or vanishing point of the map to reduce distortion when floating elements are displayed over the map.
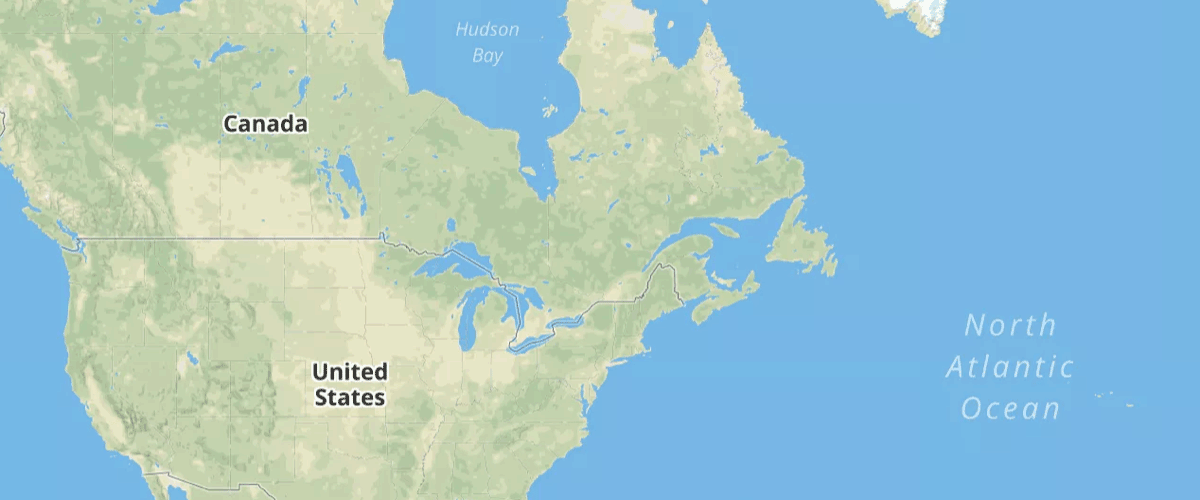
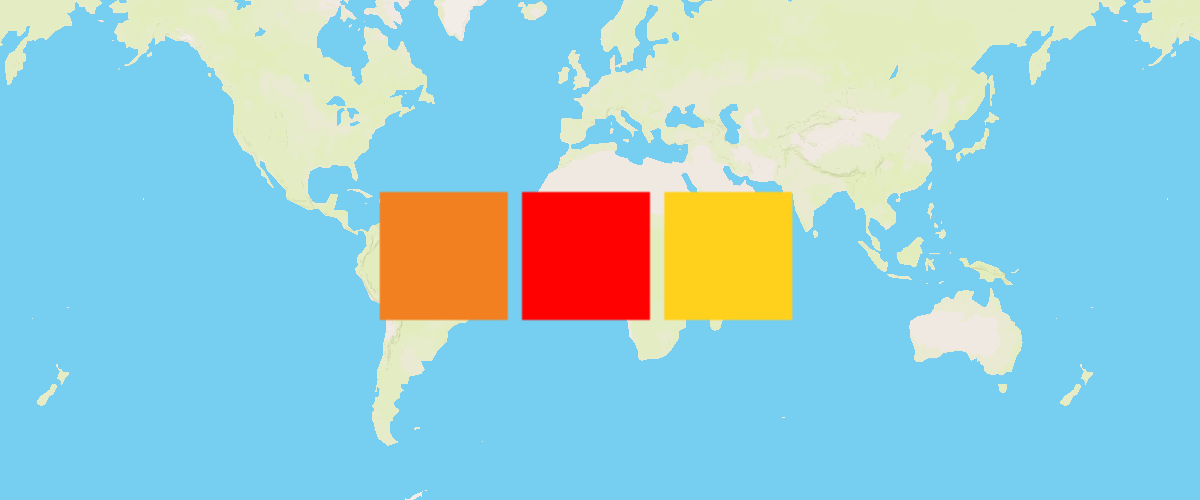
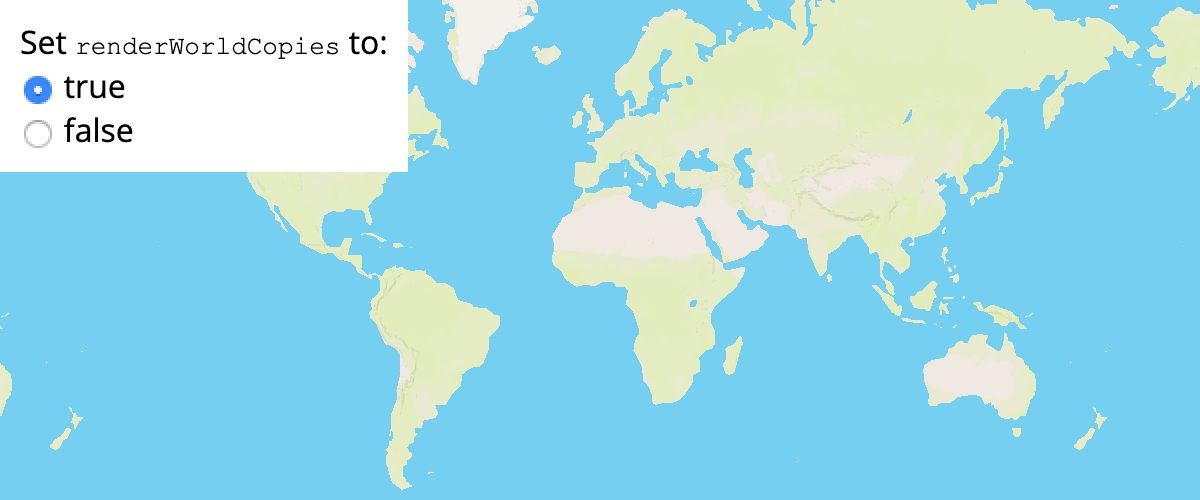 Render world copies
Toggle between rendering a single world and multiple copies of the world using setRenderWorldCopies.
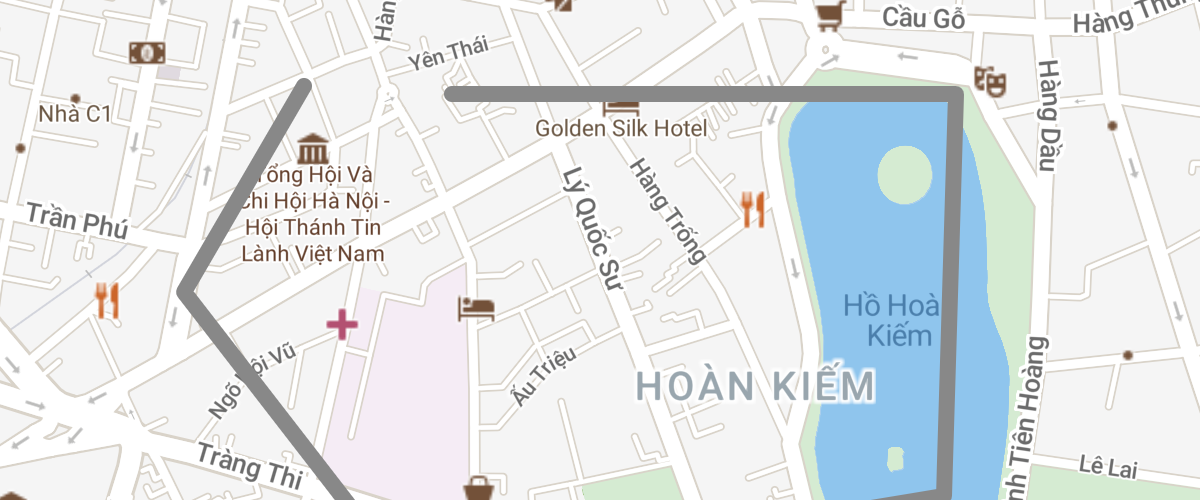
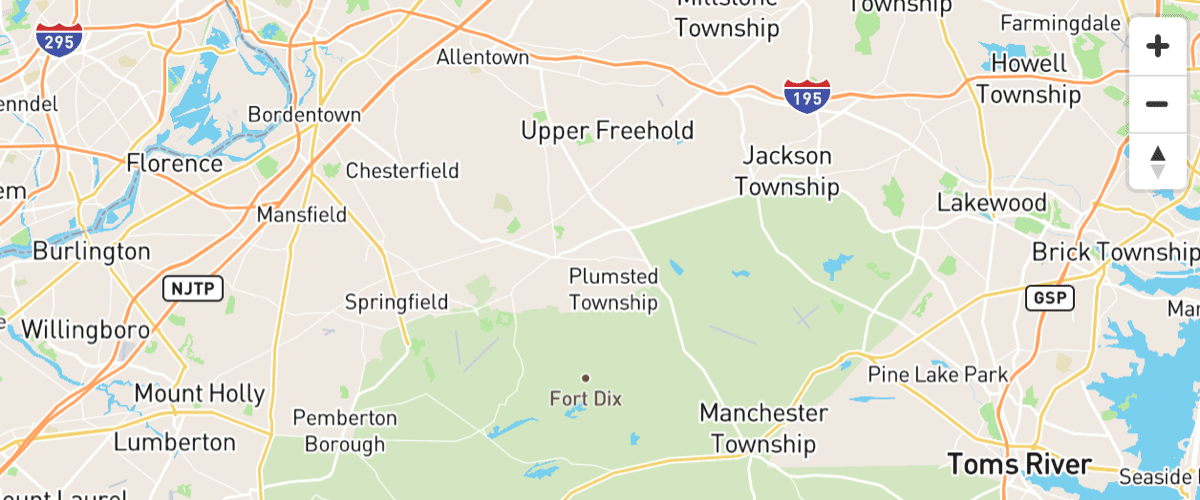
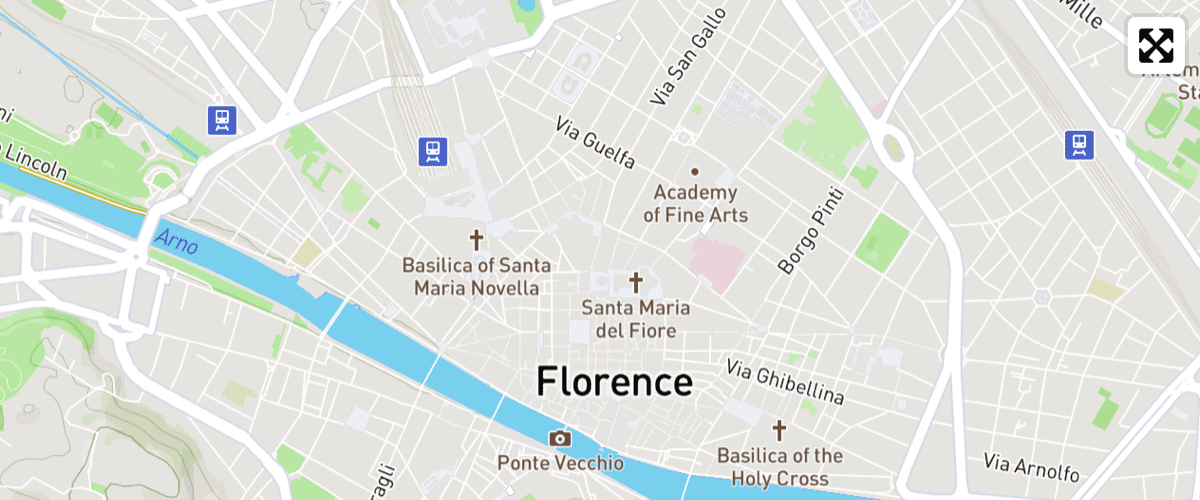
 Restrict map panning to an area
Prevent a map from being panned to a different place by setting maxBounds.
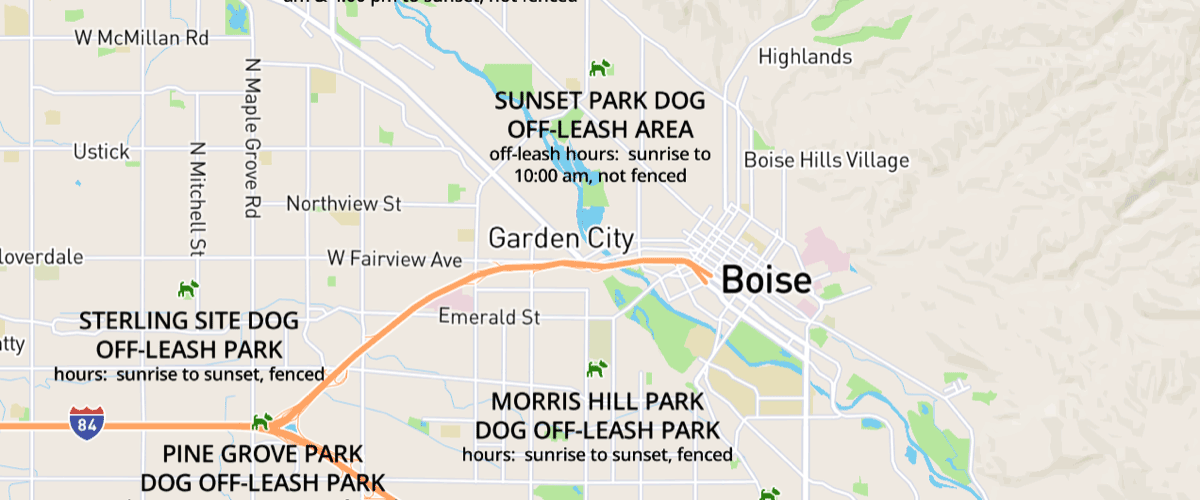
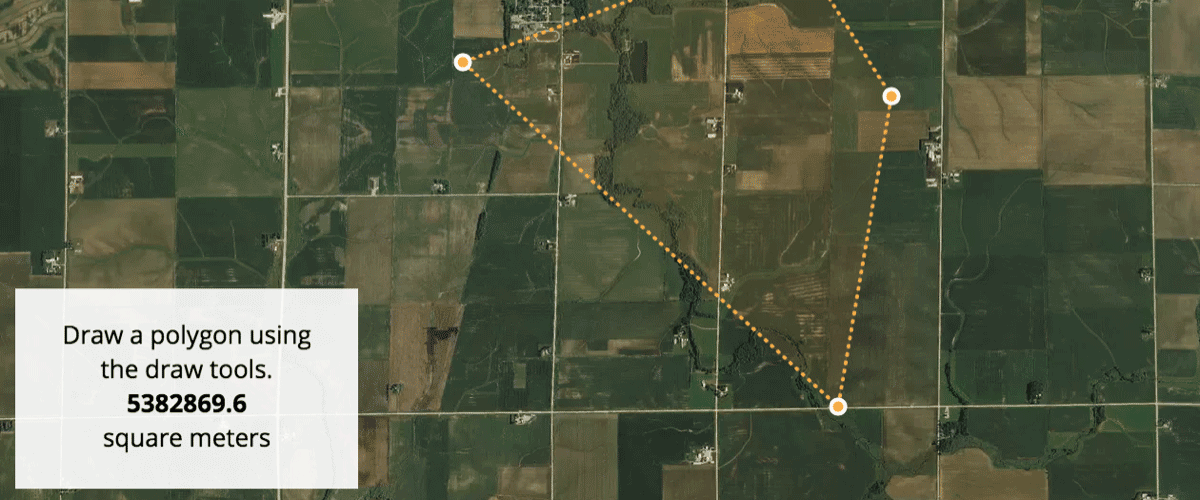 Show drawn polygon area
Use mapbox-gl-draw to draw a polygon and Turf.js to calculate its area in square meters.
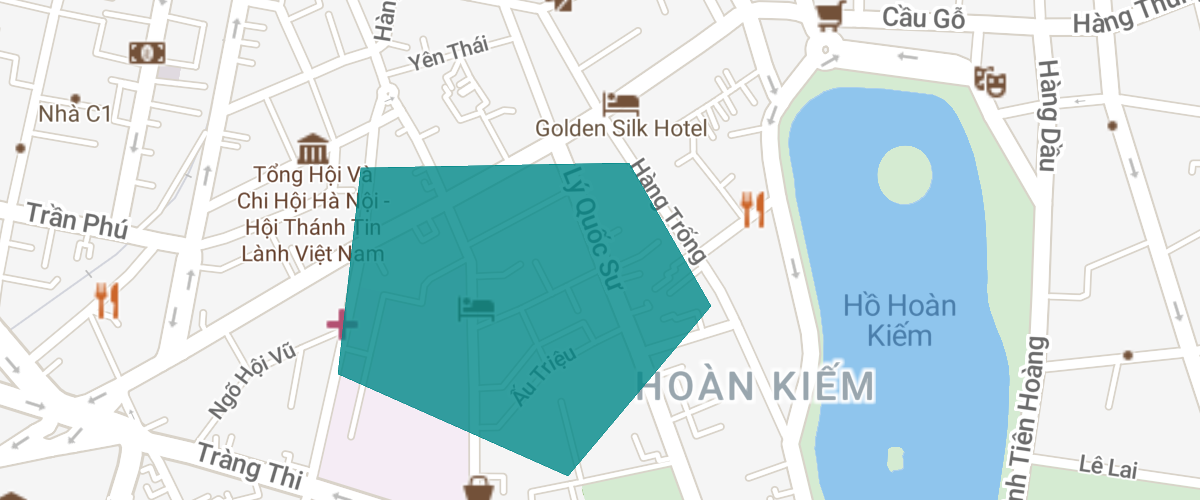
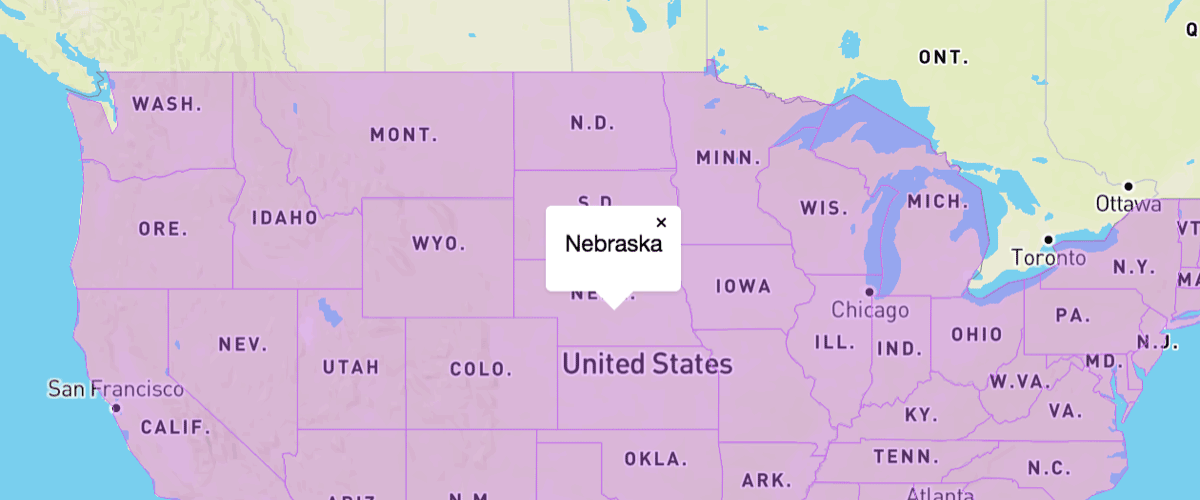 Show polygon information on click
When a user clicks a polygon, show a popup containing more information.
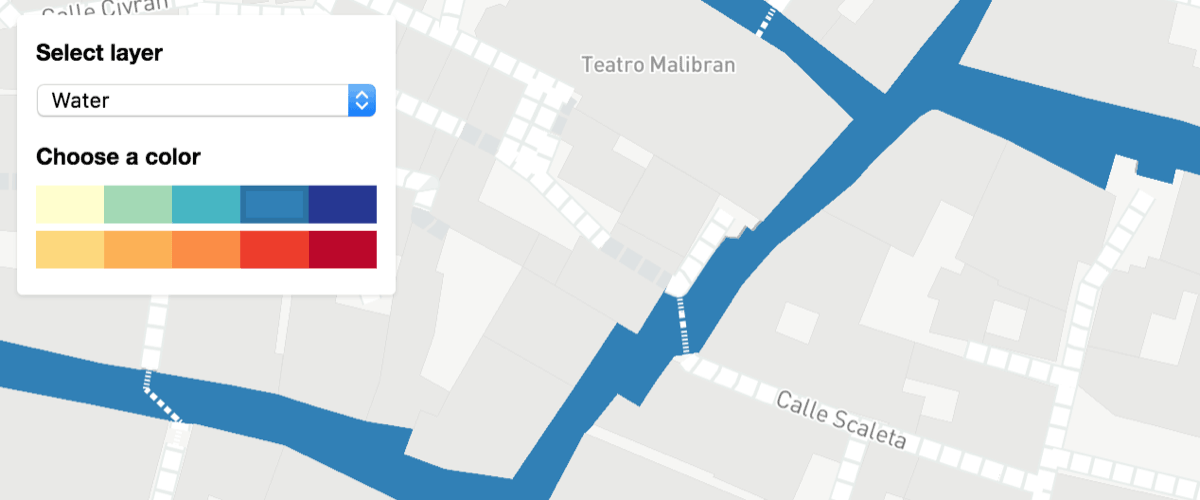
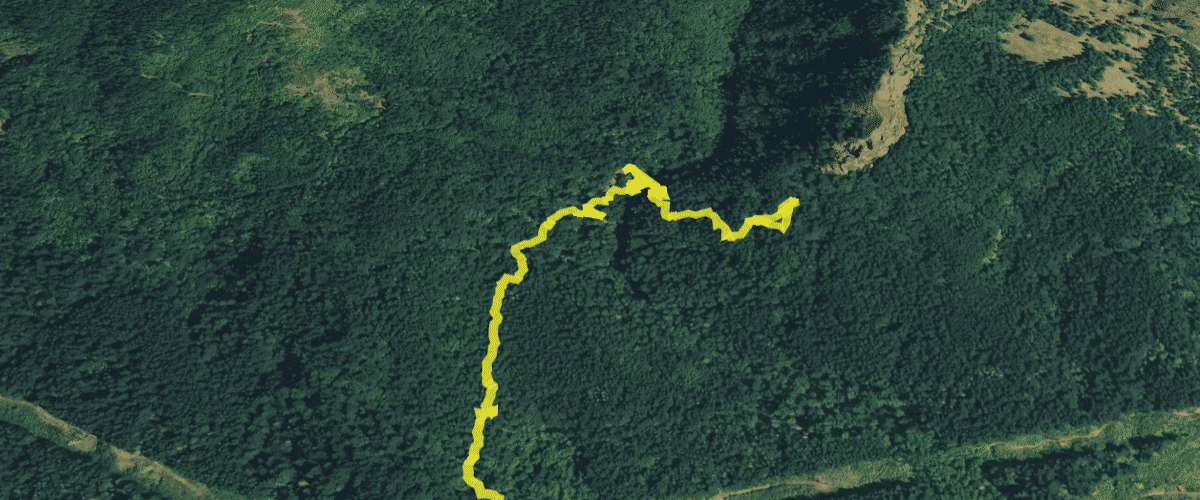
 Style lines with a data-driven property
Create a visualization with a data expression for line-color.
 Update a feature in realtime
Change an existing feature on your map in real-time by updating its data.
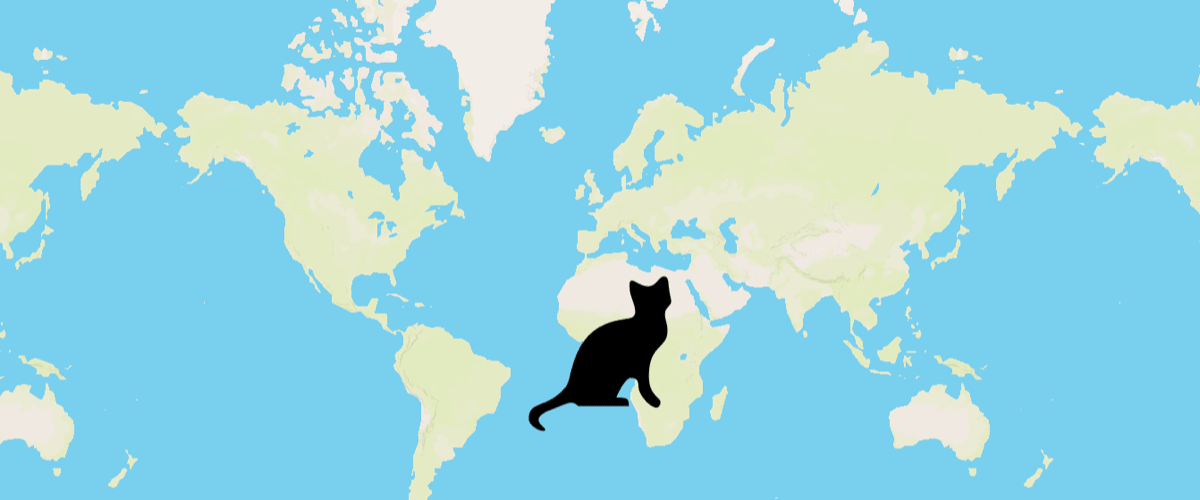
 Use a fallback image
Use a coalesce expression to display another image when a requested image is not available.
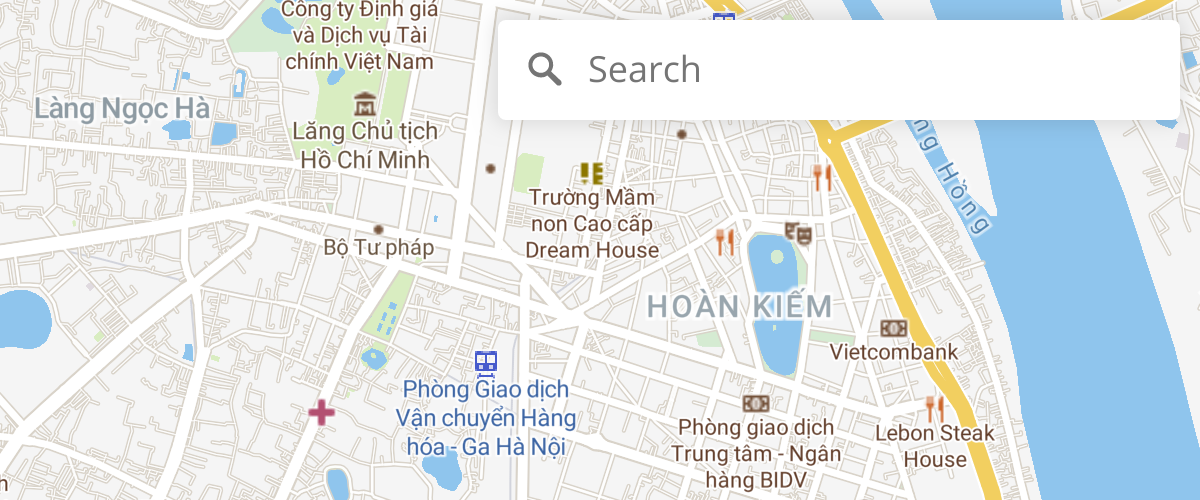
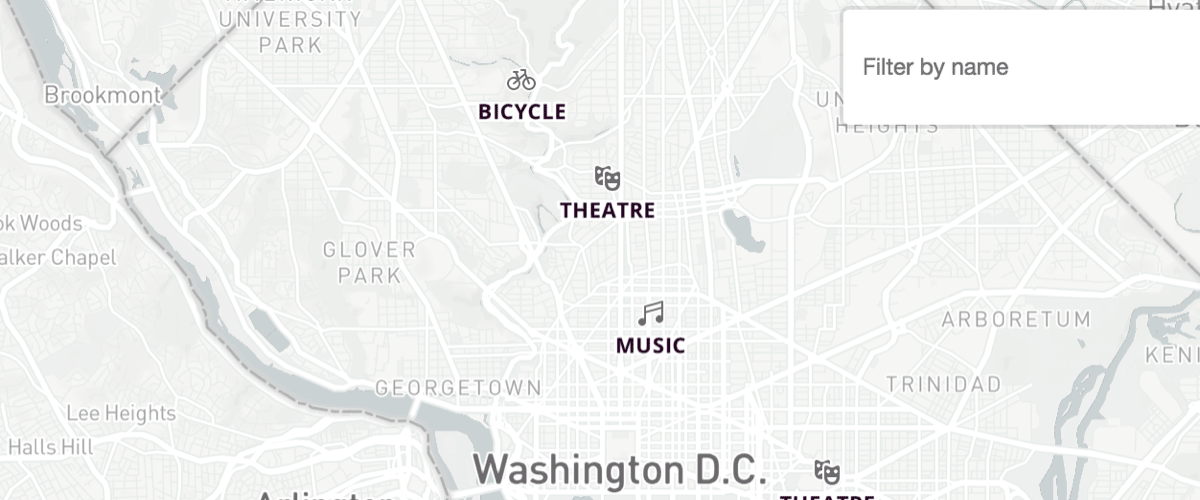
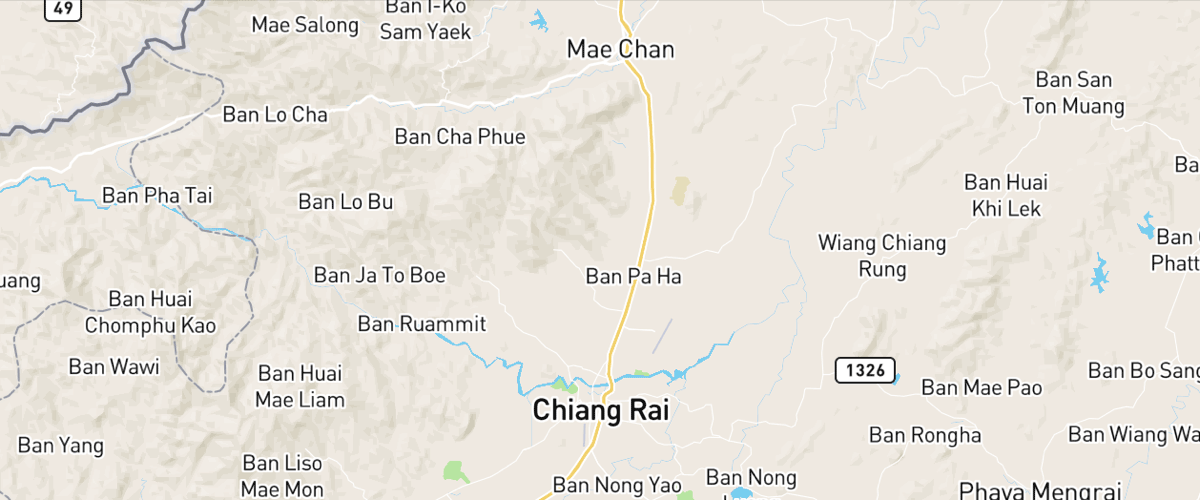
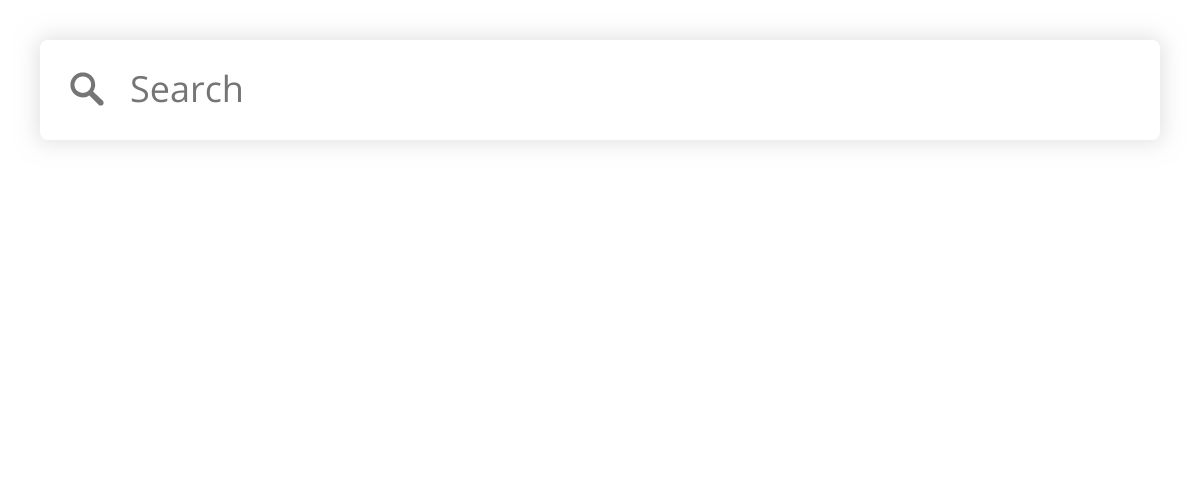 Use the autocomplete widget without a map
Use goong-geocoder-js to display a search box without a map.
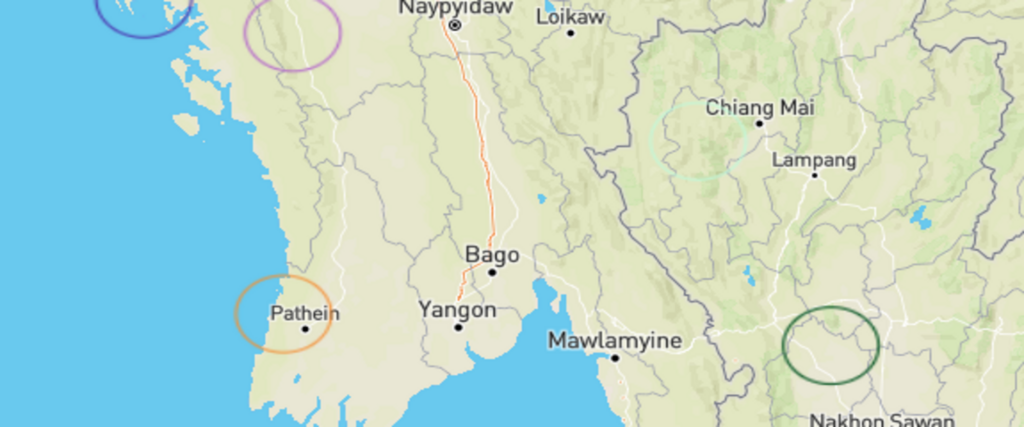
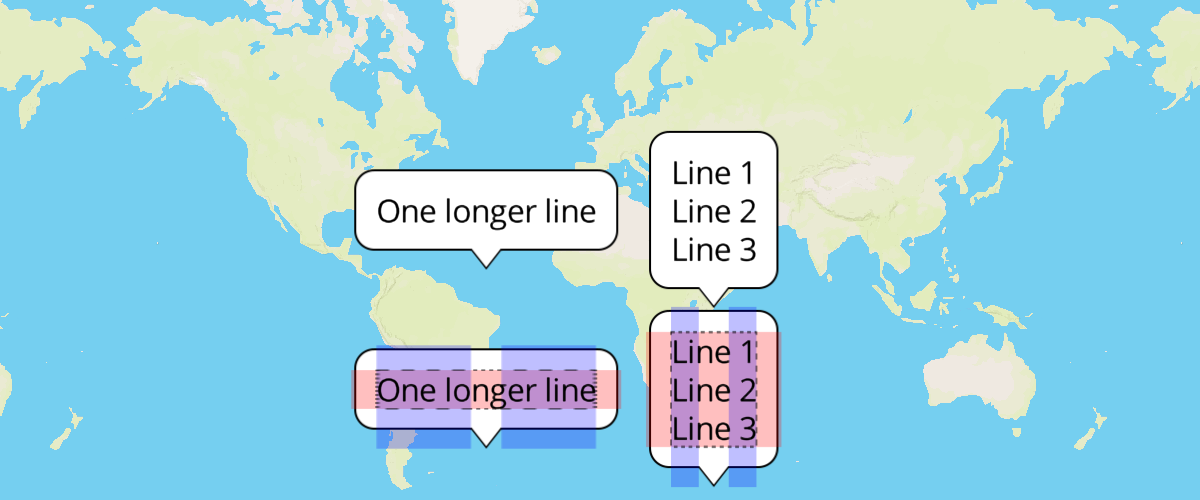
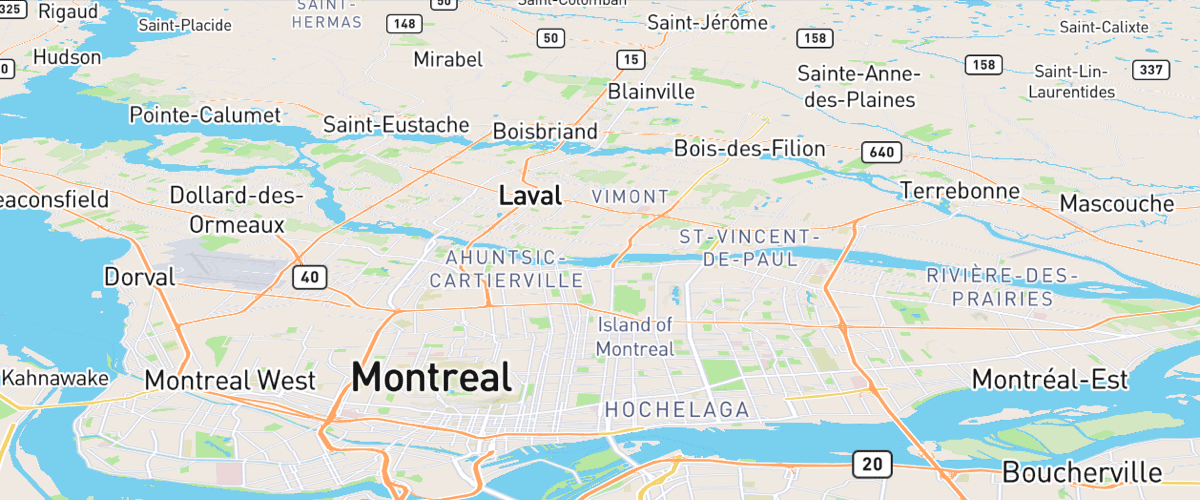
 Variable label placement
Use text-variable-anchor to allow high priority labels to shift position to stay on the map.
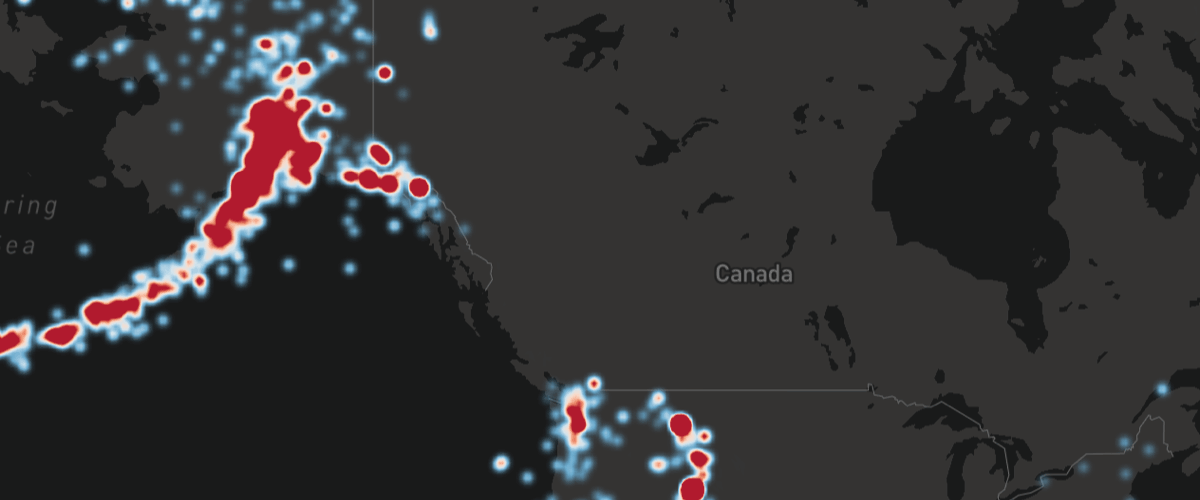
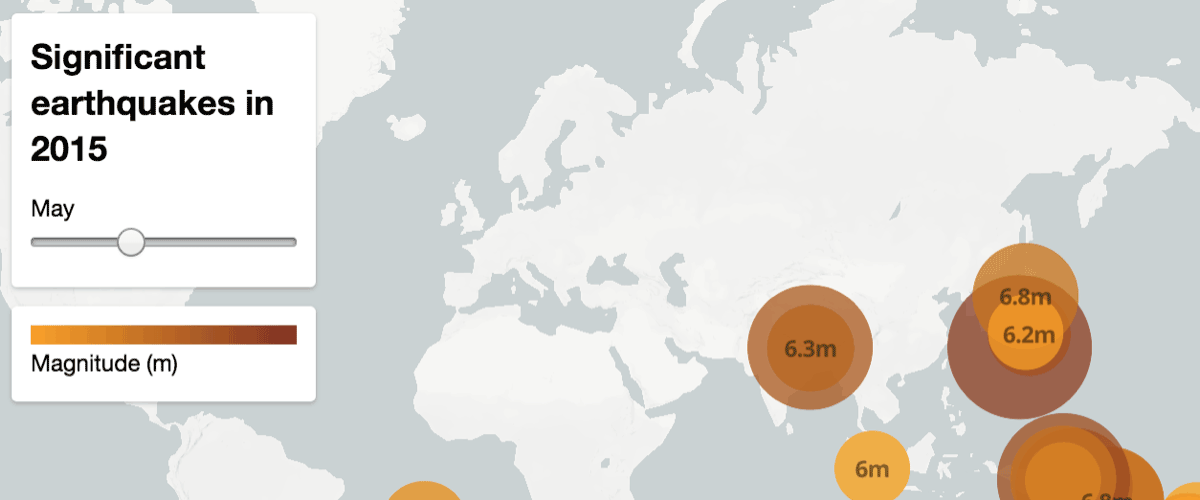
 Visualize population density
Use a variable binding expression to calculate and display population density.